Estimated Value: $167,000 - $248,000
4
Beds
4
Baths
2,716
Sq Ft
$76/Sq Ft
Est. Value
About This Home
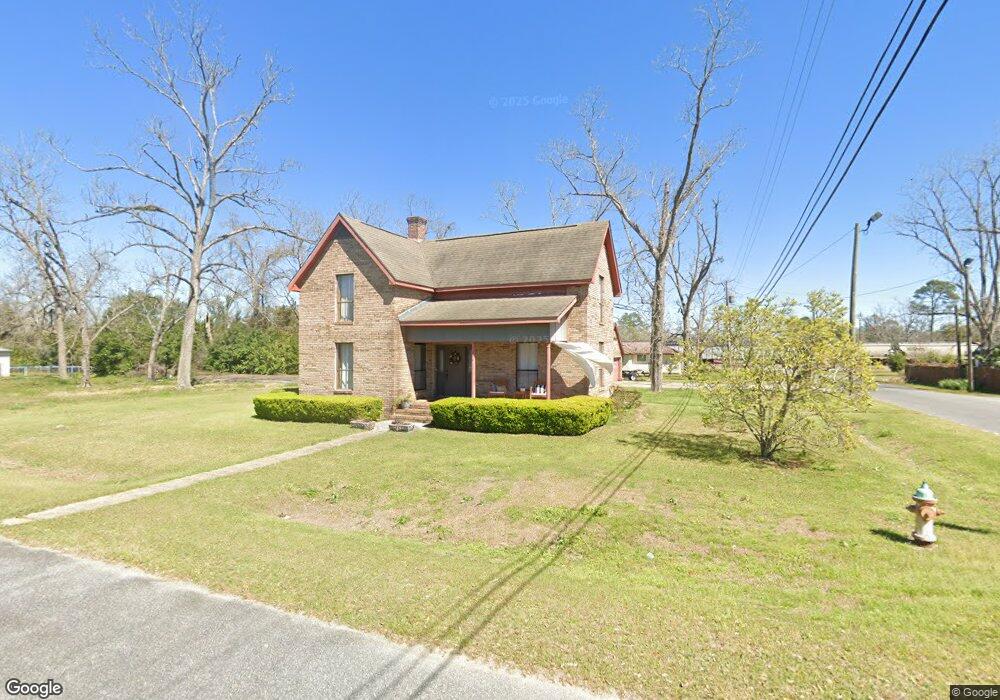
This home is located at 115 Union St, Cecil, GA 31627 and is currently estimated at $206,807, approximately $76 per square foot. 115 Union St is a home located in Cook County with nearby schools including Cook Primary School, Cook Elementary School, and Cook County Middle School.
Ownership History
Date
Name
Owned For
Owner Type
Purchase Details
Closed on
Mar 31, 2020
Sold by
Williams Lamar
Bought by
Williams Talmadge Lamar and Williams Tacey Brooke
Current Estimated Value
Purchase Details
Closed on
Dec 18, 2008
Sold by
Clarke Thomas Willard
Bought by
Williams Lamar
Home Financials for this Owner
Home Financials are based on the most recent Mortgage that was taken out on this home.
Original Mortgage
$124,000
Interest Rate
5.96%
Mortgage Type
New Conventional
Purchase Details
Closed on
Dec 7, 2006
Sold by
Sec Of Housing & U
Bought by
Clarke Thomas Williams and Clarke Karen L
Home Financials for this Owner
Home Financials are based on the most recent Mortgage that was taken out on this home.
Original Mortgage
$70,200
Interest Rate
6.31%
Mortgage Type
New Conventional
Purchase Details
Closed on
Jun 7, 2005
Sold by
Washington Mutual Bank
Bought by
Sec Of Housing & Urban
Create a Home Valuation Report for This Property
The Home Valuation Report is an in-depth analysis detailing your home's value as well as a comparison with similar homes in the area
Home Values in the Area
Average Home Value in this Area
Purchase History
| Date | Buyer | Sale Price | Title Company |
|---|---|---|---|
| Williams Talmadge Lamar | -- | -- | |
| Williams Lamar | $120,500 | -- | |
| Clarke Thomas Williams | $72,848 | -- | |
| Sec Of Housing & Urban | $120,221 | -- | |
| Washington Mutual Bank | $120,221 | -- |
Source: Public Records
Mortgage History
| Date | Status | Borrower | Loan Amount |
|---|---|---|---|
| Previous Owner | Williams Lamar | $124,000 | |
| Previous Owner | Clarke Thomas Williams | $70,200 |
Source: Public Records
Tax History Compared to Growth
Tax History
| Year | Tax Paid | Tax Assessment Tax Assessment Total Assessment is a certain percentage of the fair market value that is determined by local assessors to be the total taxable value of land and additions on the property. | Land | Improvement |
|---|---|---|---|---|
| 2024 | $2,622 | $68,453 | $1,371 | $67,082 |
| 2023 | $2,273 | $58,990 | $1,224 | $57,766 |
| 2022 | $1,589 | $58,990 | $1,224 | $57,766 |
| 2021 | $1,401 | $48,518 | $1,224 | $47,294 |
| 2020 | $1,401 | $48,518 | $1,224 | $47,294 |
| 2019 | $1,402 | $48,518 | $1,224 | $47,294 |
| 2018 | $2,029 | $48,518 | $1,224 | $47,294 |
| 2017 | $1,403 | $48,518 | $1,224 | $47,294 |
| 2016 | $1,411 | $48,717 | $1,423 | $47,294 |
| 2015 | $1,414 | $48,743 | $1,449 | $47,294 |
| 2014 | $1,417 | $48,743 | $1,449 | $47,294 |
| 2013 | -- | $48,743 | $1,449 | $47,294 |
Source: Public Records
Map
Nearby Homes
- 66 Hinson St
- 1864 Caulie Harris Rd
- 7909 Webb Rd N
- 8009 Webb Rd N
- 331 Barry Field Cir
- 335 Barry Field Cir
- 355 Barry Field Cir
- 343 Barry Field Cir
- 339 Barry Field Cir
- 347 Barry Field Cir
- 107 Floyd McNeal Dr
- 117 Floyd McNeal Dr
- 374 Barry Field Cir
- 186 Jefferson Rd
- 168 Floyd McNeal Dr
- 351 Barry Field Cir
- 169 Audrey Ln
- 228 Barry Field Cir
- 7305 Wind Chase Dr
- 7250 Tillman Branch Rd
- 204 W Roundtree St
- 507 Railroad St
- 126 Railroad St
- 176 Railroad St
- 112 Union St
- 67 Union St
- 70 Union St
- 14 Main St
- 706 N Street Cecil
- 84 Williams St
- I-75 I-75 & Coffee Rd
- 77 E Roundtree St
- 108 Rountree Ln
- 45 North St
- 107 William Browning Rd
- 26 Union St
- 84 Williams St
- 107 Williams St
- 110 Old Coffee Rd
- 110 Old Coffee Rd