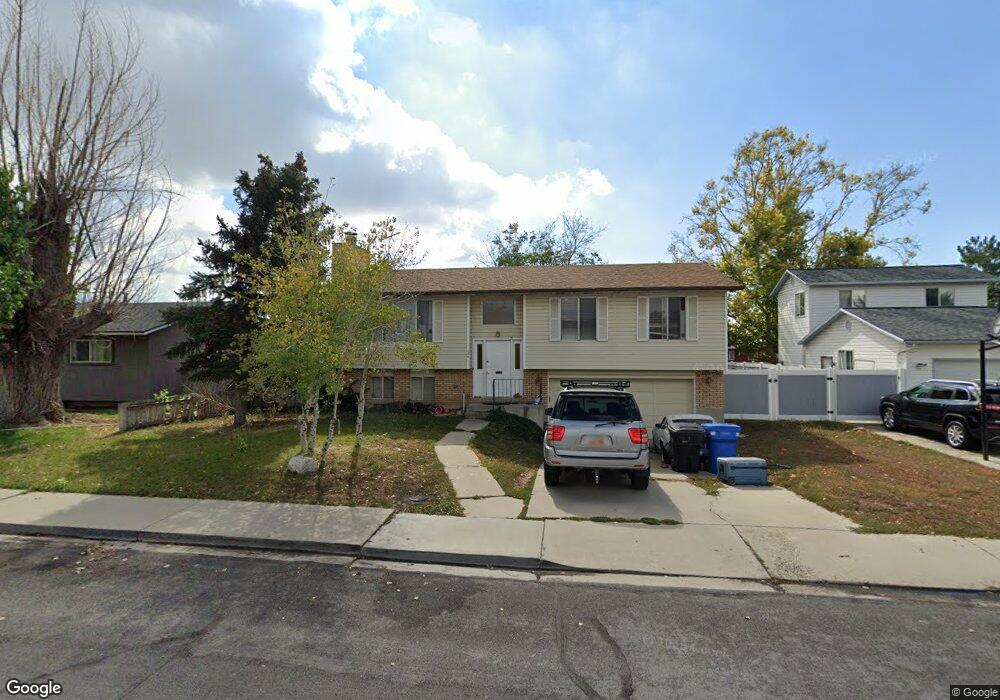
115 W 220 S Orem, UT 84058
Orem Park NeighborhoodEstimated Value: $470,509 - $506,000
4
Beds
2
Baths
1,726
Sq Ft
$280/Sq Ft
Est. Value
About This Home
This home is located at 115 W 220 S, Orem, UT 84058 and is currently estimated at $483,503, approximately $280 per square foot. 115 W 220 S is a home located in Utah County with nearby schools including Orem Elementary School, Orem Junior High School, and Mountain View High School.
Ownership History
Date
Name
Owned For
Owner Type
Purchase Details
Closed on
Aug 1, 2011
Sold by
Day Jordan A and Day Jill C
Bought by
Losee Brian
Current Estimated Value
Purchase Details
Closed on
Aug 3, 2009
Sold by
Day Jordan Alex and Day Jill C Gamette
Bought by
Day Jordan A and Day Jill C
Create a Home Valuation Report for This Property
The Home Valuation Report is an in-depth analysis detailing your home's value as well as a comparison with similar homes in the area
Home Values in the Area
Average Home Value in this Area
Purchase History
| Date | Buyer | Sale Price | Title Company |
|---|---|---|---|
| Losee Brian | -- | Utah Standard Title | |
| Day Jordan A | -- | None Available |
Source: Public Records
Tax History
| Year | Tax Paid | Tax Assessment Tax Assessment Total Assessment is a certain percentage of the fair market value that is determined by local assessors to be the total taxable value of land and additions on the property. | Land | Improvement |
|---|---|---|---|---|
| 2025 | $1,857 | $241,945 | -- | -- |
| 2024 | $1,857 | $227,040 | $0 | $0 |
| 2023 | $1,732 | $227,590 | $0 | $0 |
| 2022 | $1,793 | $228,305 | $0 | $0 |
| 2021 | $1,664 | $321,800 | $163,800 | $158,000 |
| 2020 | $1,505 | $285,200 | $130,300 | $154,900 |
| 2019 | $1,322 | $260,500 | $120,300 | $140,200 |
| 2018 | $1,199 | $225,800 | $103,600 | $122,200 |
| 2017 | $1,096 | $110,605 | $0 | $0 |
| 2016 | $1,066 | $99,165 | $0 | $0 |
| 2015 | $1,075 | $94,600 | $0 | $0 |
| 2014 | $1,063 | $93,115 | $0 | $0 |
Source: Public Records
Map
Nearby Homes
Your Personal Tour Guide
Ask me questions while you tour the home.