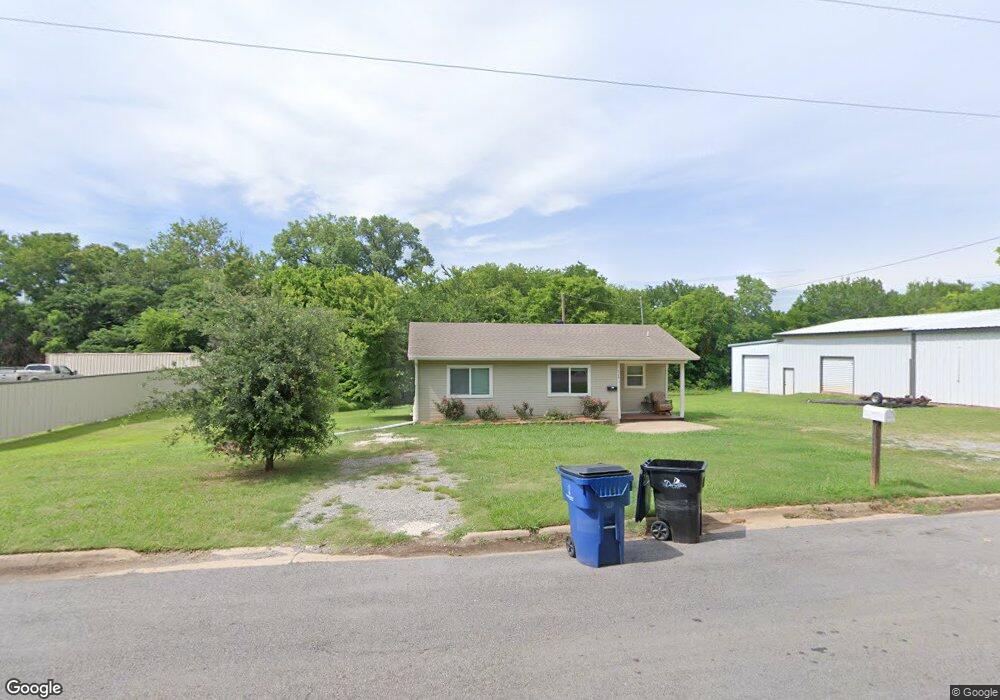
115 W Day St Denison, TX 75021
Estimated Value: $151,000 - $158,797
2
Beds
1
Bath
871
Sq Ft
$178/Sq Ft
Est. Value
About This Home
This home is located at 115 W Day St, Denison, TX 75021 and is currently estimated at $154,899, approximately $177 per square foot. 115 W Day St is a home located in Grayson County with nearby schools including Lamar Elementary School, Scott Middle School, and Denison High School.
Ownership History
Date
Name
Owned For
Owner Type
Purchase Details
Closed on
Dec 1, 2023
Sold by
Coffey Jeffrey P and Coffey Susanne H
Bought by
Mitchell Sfr Llc
Current Estimated Value
Purchase Details
Closed on
Jan 1, 2022
Sold by
Paige Hudson
Bought by
Coffey Jeffrey P
Purchase Details
Closed on
May 9, 2019
Sold by
Coffey Jeffrey P and Coffey Jeff
Bought by
Hudson Paige and Tello Jose
Home Financials for this Owner
Home Financials are based on the most recent Mortgage that was taken out on this home.
Original Mortgage
$82,000
Interest Rate
4%
Mortgage Type
Seller Take Back
Purchase Details
Closed on
Dec 1, 2015
Sold by
Brown James E and Brown Freda G
Bought by
Coffey Jeff
Purchase Details
Closed on
Aug 12, 2010
Sold by
Brown Doug
Bought by
Brown James E and Brown Freda G
Create a Home Valuation Report for This Property
The Home Valuation Report is an in-depth analysis detailing your home's value as well as a comparison with similar homes in the area
Home Values in the Area
Average Home Value in this Area
Purchase History
| Date | Buyer | Sale Price | Title Company |
|---|---|---|---|
| Mitchell Sfr Llc | -- | None Listed On Document | |
| Coffey Jeffrey P | -- | New Title Company Name | |
| Hudson Paige | -- | None Available | |
| Coffey Jeff | -- | Grayson County Title | |
| Brown James E | -- | None Available |
Source: Public Records
Mortgage History
| Date | Status | Borrower | Loan Amount |
|---|---|---|---|
| Previous Owner | Hudson Paige | $82,000 |
Source: Public Records
Tax History Compared to Growth
Tax History
| Year | Tax Paid | Tax Assessment Tax Assessment Total Assessment is a certain percentage of the fair market value that is determined by local assessors to be the total taxable value of land and additions on the property. | Land | Improvement |
|---|---|---|---|---|
| 2025 | $2,789 | $119,749 | $34,875 | $84,874 |
| 2024 | $2,789 | $120,023 | $34,875 | $85,148 |
| 2023 | $2,675 | $118,074 | $34,950 | $83,124 |
| 2022 | $2,268 | $95,454 | $31,050 | $64,404 |
| 2021 | $1,790 | $70,988 | $20,625 | $50,363 |
| 2020 | $1,734 | $65,748 | $15,000 | $50,748 |
| 2019 | $1,694 | $61,548 | $9,000 | $52,548 |
| 2018 | $1,576 | $56,819 | $6,000 | $50,819 |
| 2017 | $1,463 | $52,299 | $3,450 | $48,849 |
| 2016 | $1,389 | $49,647 | $2,400 | $47,247 |
| 2015 | $0 | $34,928 | $2,400 | $32,528 |
| 2014 | -- | $30,503 | $2,400 | $28,103 |
Source: Public Records
Map
Nearby Homes
- 110 E Munson St
- 326 W Day St
- 215 E Nelson St
- 200 E Morgan St
- 129 Texas E
- 408 W Day St
- 1110 S Houston Ave
- 326-328 W Morgan St
- 330 W Morgan St
- 108 E Nelson St
- 0 E Nelson St
- 315 E Hull St
- 221 W Monterey St
- 633 Munson St
- 629 Munson St
- 430 W Munson St
- 331 E Hull St
- 1046 E Owings St
- 309 W Monterey St
- 330 W Texas St