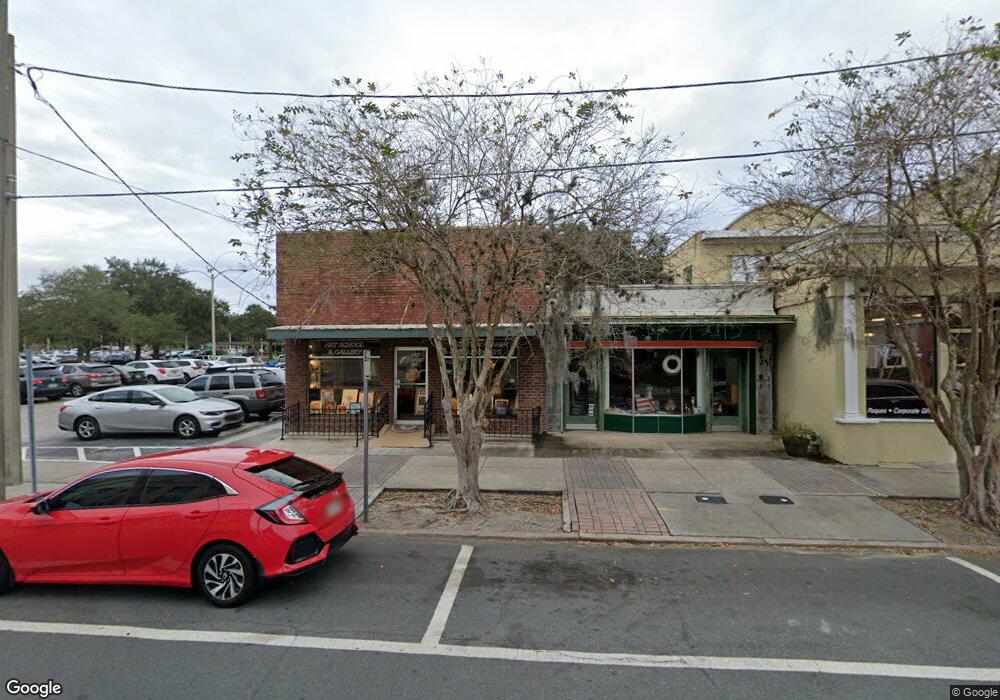
115 W Rich Ave Deland, FL 32720
Estimated Value: $452,493
--
Bed
1
Bath
1,922
Sq Ft
$235/Sq Ft
Est. Value
About This Home
This home is located at 115 W Rich Ave, Deland, FL 32720 and is currently estimated at $452,493, approximately $235 per square foot. 115 W Rich Ave is a home located in Volusia County with nearby schools including Deland High School, Woodward Avenue Elementary School, and Southwestern Middle School.
Ownership History
Date
Name
Owned For
Owner Type
Purchase Details
Closed on
Dec 31, 2019
Sold by
Hansen Kermit H and Hansen Judy A
Bought by
William J Jennings Frank Jennings & Fl F
Current Estimated Value
Purchase Details
Closed on
Jul 19, 2007
Sold by
Cook John A and Cook Mary K
Bought by
Hansen Kermit H and Hansen Judy A
Home Financials for this Owner
Home Financials are based on the most recent Mortgage that was taken out on this home.
Original Mortgage
$1,220
Interest Rate
5%
Mortgage Type
Seller Take Back
Purchase Details
Closed on
Jun 29, 2000
Sold by
Plumley Raymond and Plumley Lillian
Bought by
Cook John A and Cook Mary K
Home Financials for this Owner
Home Financials are based on the most recent Mortgage that was taken out on this home.
Original Mortgage
$65,359
Interest Rate
8.63%
Mortgage Type
Commercial
Purchase Details
Closed on
Jun 15, 1986
Bought by
Hansen Kermit H and Hansen Judy A
Purchase Details
Closed on
Sep 15, 1972
Bought by
Hansen Kermit H and Hansen Judy A
Create a Home Valuation Report for This Property
The Home Valuation Report is an in-depth analysis detailing your home's value as well as a comparison with similar homes in the area
Home Values in the Area
Average Home Value in this Area
Purchase History
| Date | Buyer | Sale Price | Title Company |
|---|---|---|---|
| William J Jennings Frank Jennings & Fl F | $400,000 | Ability Title Inc | |
| Hansen Kermit H | $275,000 | Vision Title Of Deland Llc | |
| Cook John A | -- | -- | |
| Cook John A | $77,500 | -- | |
| Hansen Kermit H | $50,000 | -- | |
| Hansen Kermit H | $28,000 | -- |
Source: Public Records
Mortgage History
| Date | Status | Borrower | Loan Amount |
|---|---|---|---|
| Previous Owner | Hansen Kermit H | $1,220 | |
| Previous Owner | Cook John A | $65,359 |
Source: Public Records
Tax History Compared to Growth
Tax History
| Year | Tax Paid | Tax Assessment Tax Assessment Total Assessment is a certain percentage of the fair market value that is determined by local assessors to be the total taxable value of land and additions on the property. | Land | Improvement |
|---|---|---|---|---|
| 2025 | $3,918 | $270,172 | $128,680 | $141,492 |
| 2024 | $3,918 | $267,478 | $128,680 | $138,798 |
| 2023 | $3,918 | $259,771 | $128,680 | $131,091 |
| 2022 | $3,568 | $225,855 | $112,595 | $113,260 |
| 2021 | $3,198 | $155,652 | $64,340 | $91,312 |
| 2020 | $3,226 | $156,551 | $64,340 | $92,211 |
| 2019 | $2,511 | $116,299 | $57,906 | $58,393 |
| 2018 | $2,490 | $110,624 | $57,906 | $52,718 |
| 2017 | $2,525 | $108,277 | $57,906 | $50,371 |
| 2016 | $2,364 | $102,945 | $0 | $0 |
| 2015 | $2,282 | $96,179 | $0 | $0 |
| 2014 | $2,301 | $94,750 | $0 | $0 |
Source: Public Records
Map
Nearby Homes
- 0 N Woodland Blvd Unit V4918224
- 113 S Woodland Blvd
- 431 N Sans Souci Ave
- 404 N Clara Ave
- 125 W Voorhis Ave
- 333 E Church St
- 334 W Howry Ave
- 205 E Voorhis Ave
- 0 Deland Unit R11052053
- 0 Deland Unit MFRV4942835
- 0 Deland Unit 1213697
- 210 W University Ave
- 324 S Osceola St
- 47 Villa Villar Ct Unit 470
- 615 N Palmetto Ct
- 135 S Arlington Ave
- 351 S Osceola St
- 5 Villa Villar Ct Unit 50
- 35 Villa Villar Ct Unit 35
- 134 S Julia Ave
- 206 N Woodland Blvd
- 136 N Woodland Blvd
- 134 N Woodland Blvd
- 207 N Woodland Blvd
- 132 N Woodland Blvd
- 111 W Indiana Ave
- 143 N Woodland Blvd Unit Suite 2
- 143 N Woodland Blvd Unit 1st floor
- 143 N Woodland Blvd
- 139 N Woodland Blvd
- 124 N Woodland Blvd
- 111 E Rich Ave
- 115 E Rich Ave
- 230 N Woodland Blvd
- 124 E Rich Ave
- 112 W Indiana Ave Unit 202
- 112 W Indiana Ave
- 112 W Indiana Ave Unit 102
- 112 W Indiana Ave Unit 204
- 112 W Indiana Ave Unit 206