
Seller's Agent in 2024
Elizabeth Morawiak - Paczuska
Preferred Properties Realty, LLC
(617) 416-4173
1 in this area
21 Total Sales


Estimated Value: $342,000 - $392,000
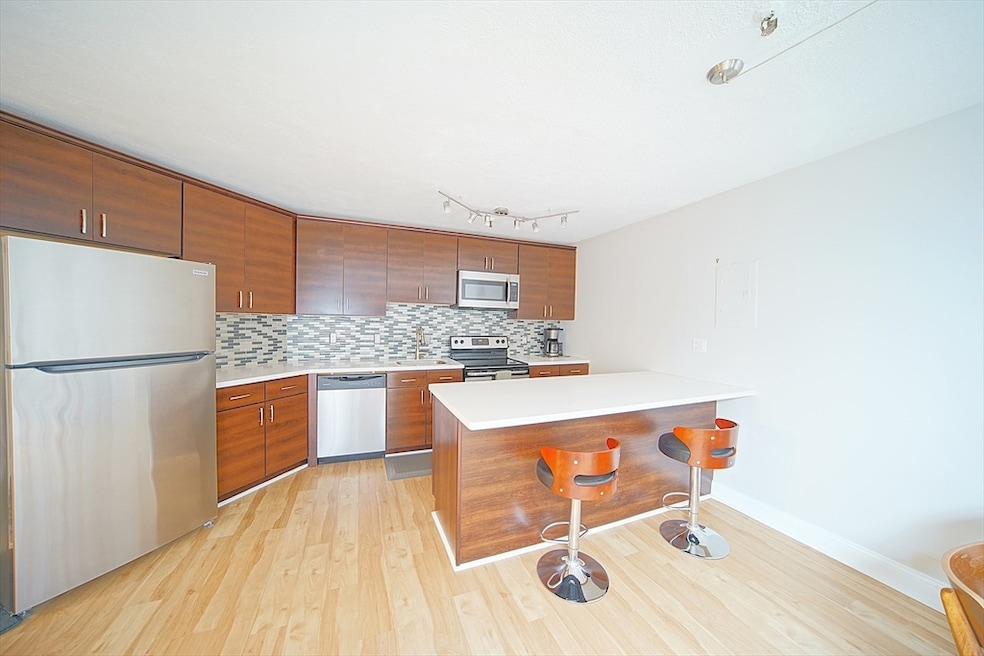
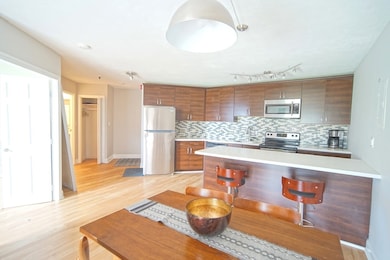
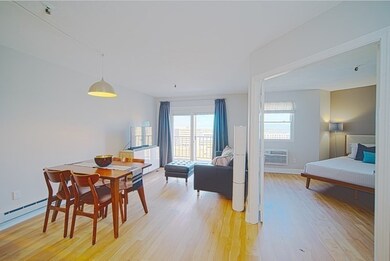
Chic top floor condo with stunning views in North Quincy. Experience the height of urban living in this move-in ready one bedroom unit. Featuring an expansive balcony with panoramic views of the Boston skyline and Wollaston Beach. Enjoy a modern, open-concept interior with new flooring and an updated kitchen boasting stainless steel appliances and Corian countertop. Perfectly positioned for convenience to the T-Station and downtown North Quincy, Embrace a lifestyle of comfort and Convenience in a prime location.
Last Agent to Sell the Property
Preferred Properties Realty, LLC Listed on: 06/06/2024
Last Buyer's Agent
Michaela Hellman
Redfin Corp.
| Date | Buyer | Sale Price | Title Company |
|---|---|---|---|
| Menezes-Odell Clistenes | $270,000 | -- | |
| Wang Shixiong | $216,200 | -- | |
| Butler Derek | $203,000 | -- | |
| Butler Derek | $203,000 | -- | |
| Marangiello Silvio | $211,345 | -- | |
| Marangiello Silvio | $211,345 | -- | |
| Lauritzen Karen | $192,000 | -- | |
| Lauritzen Karen | $192,000 | -- | |
| Mullen Eileen A | $119,000 | -- | |
| Anderson Stephen L | $64,000 | -- |
| Date | Status | Borrower | Loan Amount |
|---|---|---|---|
| Open | Menezes-Odell Clistenes | $261,900 | |
| Closed | Anderson Stephen L | $261,900 | |
| Previous Owner | Butler Derek | $182,700 |
| Date | Event | Price | List to Sale | Price per Sq Ft | Prior Sale |
|---|---|---|---|---|---|
| 08/21/2024 08/21/24 | Sold | $370,000 | -0.8% | $540 / Sq Ft | |
| 07/21/2024 07/21/24 | Pending | -- | -- | -- | |
| 06/24/2024 06/24/24 | Price Changed | $373,000 | -6.7% | $545 / Sq Ft | |
| 06/07/2024 06/07/24 | For Sale | $399,900 | +48.1% | $584 / Sq Ft | |
| 01/19/2017 01/19/17 | Sold | $270,000 | -2.9% | $394 / Sq Ft | View Prior Sale |
| 12/05/2016 12/05/16 | Pending | -- | -- | -- | |
| 11/15/2016 11/15/16 | For Sale | $278,000 | +28.6% | $406 / Sq Ft | |
| 12/31/2014 12/31/14 | Sold | $216,200 | 0.0% | $316 / Sq Ft | View Prior Sale |
| 12/29/2014 12/29/14 | Pending | -- | -- | -- | |
| 12/01/2014 12/01/14 | Off Market | $216,200 | -- | -- | |
| 11/10/2014 11/10/14 | For Sale | $219,900 | +8.3% | $321 / Sq Ft | |
| 12/12/2013 12/12/13 | Sold | $203,000 | 0.0% | $296 / Sq Ft | View Prior Sale |
| 11/25/2013 11/25/13 | Pending | -- | -- | -- | |
| 11/09/2013 11/09/13 | Off Market | $203,000 | -- | -- | |
| 11/04/2013 11/04/13 | Price Changed | $205,000 | -2.4% | $299 / Sq Ft | |
| 10/17/2013 10/17/13 | Price Changed | $210,000 | -3.7% | $307 / Sq Ft | |
| 10/03/2013 10/03/13 | For Sale | $218,000 | -- | $318 / Sq Ft |
| Year | Tax Paid | Tax Assessment Tax Assessment Total Assessment is a certain percentage of the fair market value that is determined by local assessors to be the total taxable value of land and additions on the property. | Land | Improvement |
|---|---|---|---|---|
| 2025 | $3,496 | $303,200 | $0 | $303,200 |
| 2024 | $3,118 | $276,700 | $0 | $276,700 |
| 2023 | $3,000 | $269,500 | $0 | $269,500 |
| 2022 | $3,103 | $259,000 | $0 | $259,000 |
| 2021 | $2,900 | $238,900 | $0 | $238,900 |
| 2020 | $3,105 | $249,800 | $0 | $249,800 |
| 2019 | $2,864 | $228,200 | $0 | $228,200 |
| 2018 | $2,921 | $219,000 | $0 | $219,000 |
| 2017 | $2,868 | $202,400 | $0 | $202,400 |
| 2016 | $2,636 | $183,600 | $0 | $183,600 |
| 2015 | $2,539 | $173,900 | $0 | $173,900 |
| 2014 | $2,284 | $153,700 | $0 | $153,700 |
Seller's Agent in 2024
Elizabeth Morawiak - Paczuska
Preferred Properties Realty, LLC
(617) 416-4173
1 in this area
21 Total Sales
J
Seller Co-Listing Agent in 2024
Jim Wojciechowski
Preferred Properties Realty, LLC
(617) 750-7070
1 in this area
29 Total Sales
M
Buyer's Agent in 2024
Michaela Hellman
Redfin Corp.
Seller's Agent in 2017
James Mulvey
Bird Dog Real Estate, LLC
(617) 913-0212
1 in this area
99 Total Sales
C
Seller's Agent in 2014
Corey Sprague
Kinlin Grover Compass
Buyer's Agent in 2014
Colleen Walo
Allison James Estates & Homes of MA, LLC
(617) 943-4258
56 Total Sales
Source: MLS Property Information Network (MLS PIN)
MLS Number: 73248963
APN: QUIN-006159-000039-001204
Disclaimer: Certain information contained herein is derived from information provided by parties other than Homes.com. All information provided is deemed reliable, but is not guaranteed to be accurate and should be independently verified.
![]() The property listing data and information, or the Images, set forth herein were provided to MLS Property Information Network, Inc. from third party sources, including sellers, lessors and public records, and were compiled by MLS Property Information Network, Inc. The property listing data and information, and the Images, are for the personal, non-commercial use of consumers having a good faith interest in purchasing or leasing listed properties of the type displayed to them and may not be used for any purpose other than to identify prospective properties which such consumers may have a good faith interest in purchasing or leasing. MLS Property Information Network, Inc. and its subscribers disclaim any and all representations and warranties as to the accuracy of the property listing data and information, or as to the accuracy of any of the Images, set forth herein.
The property listing data and information, or the Images, set forth herein were provided to MLS Property Information Network, Inc. from third party sources, including sellers, lessors and public records, and were compiled by MLS Property Information Network, Inc. The property listing data and information, and the Images, are for the personal, non-commercial use of consumers having a good faith interest in purchasing or leasing listed properties of the type displayed to them and may not be used for any purpose other than to identify prospective properties which such consumers may have a good faith interest in purchasing or leasing. MLS Property Information Network, Inc. and its subscribers disclaim any and all representations and warranties as to the accuracy of the property listing data and information, or as to the accuracy of any of the Images, set forth herein.