
Seller's Agent in 2024
Derek Wong
V & E Realty
(617) 290-8289
5 in this area
42 Total Sales

Estimated Value: $350,000 - $383,000
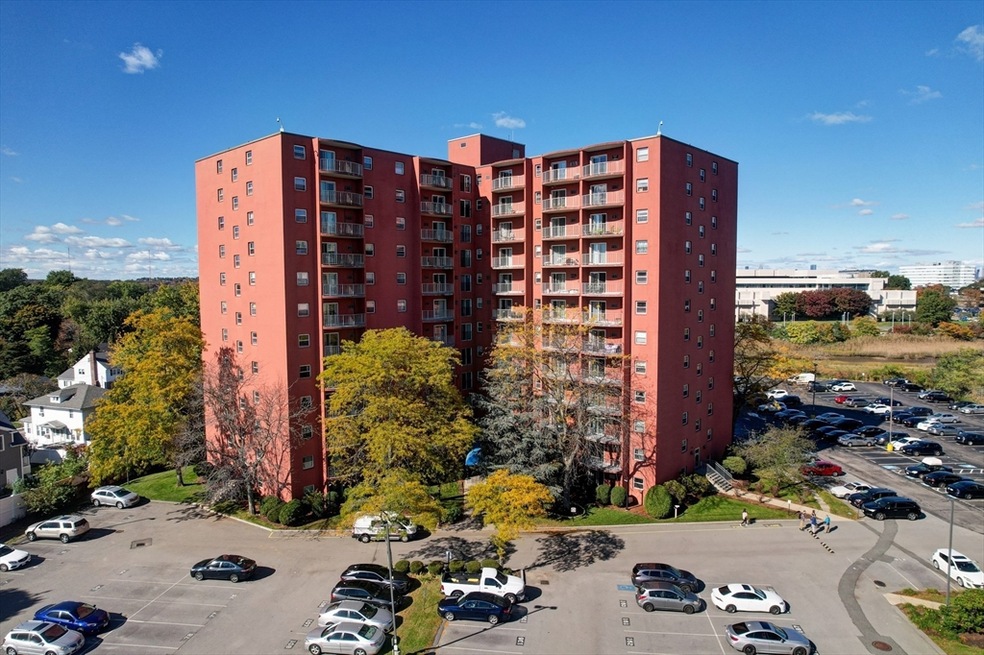
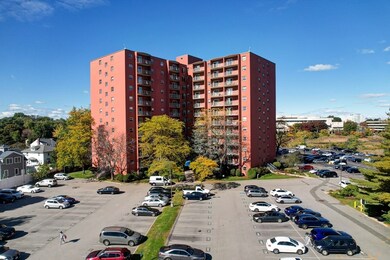
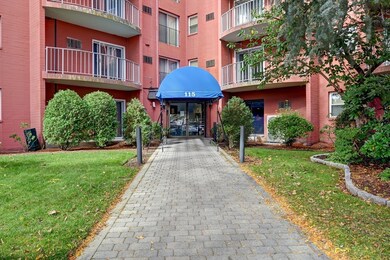
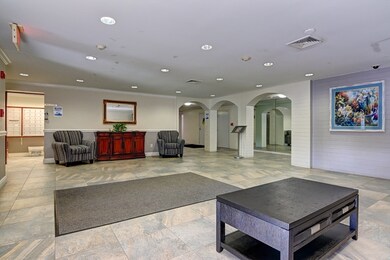
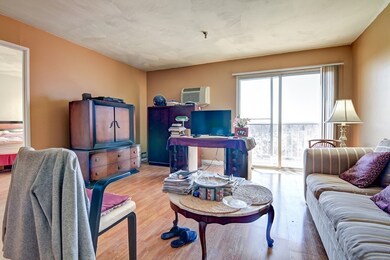
Welcome to Sagamore Place Condominiums! This penthouse unit is updated with laminate flooring, granite countertops and stainless-steel appliances. This west facing top floor location lets in a tremendous amount of light. Enjoy wonderful sunsets views from your balcony. Fantastic location with close proximity to the North Quincy T Station and all that Hancock Street has to offer. The unit is very well maintained by a long-term tenant. This is an attractive investment opportunity to have a wonderful existing tenant in place but is also an equally great opportunity to make it your own as you can move right in! Common laundry is conveniently located on the first floor. Onsite security and administration is at the front entrance. Includes deeded parking space #200. Don't miss out!
| Date | Buyer | Sale Price | Title Company |
|---|---|---|---|
| Cheung Emily | $362,000 | None Available | |
| Cheung Emily | $362,000 | None Available | |
| Zhu Cindy | $194,900 | -- |
| Date | Status | Borrower | Loan Amount |
|---|---|---|---|
| Open | Cheung Emily | $144,800 | |
| Closed | Cheung Emily | $144,800 |
| Date | Event | Price | List to Sale | Price per Sq Ft | Prior Sale |
|---|---|---|---|---|---|
| 08/26/2024 08/26/24 | Sold | $362,000 | -2.1% | $473 / Sq Ft | |
| 07/09/2024 07/09/24 | Pending | -- | -- | -- | |
| 05/29/2024 05/29/24 | For Sale | $369,900 | 0.0% | $484 / Sq Ft | |
| 02/22/2014 02/22/14 | Rented | $1,500 | 0.0% | -- | |
| 01/23/2014 01/23/14 | Under Contract | -- | -- | -- | |
| 12/28/2013 12/28/13 | For Rent | $1,500 | 0.0% | -- | |
| 10/18/2013 10/18/13 | Sold | $194,900 | 0.0% | $255 / Sq Ft | View Prior Sale |
| 09/14/2013 09/14/13 | Pending | -- | -- | -- | |
| 09/10/2013 09/10/13 | Price Changed | $194,900 | -33.9% | $255 / Sq Ft | |
| 09/09/2013 09/09/13 | For Sale | $294,900 | -- | $385 / Sq Ft |
| Year | Tax Paid | Tax Assessment Tax Assessment Total Assessment is a certain percentage of the fair market value that is determined by local assessors to be the total taxable value of land and additions on the property. | Land | Improvement |
|---|---|---|---|---|
| 2025 | $3,492 | $302,900 | $0 | $302,900 |
| 2024 | $3,352 | $297,400 | $0 | $297,400 |
| 2023 | $3,224 | $289,700 | $0 | $289,700 |
| 2022 | $3,345 | $279,200 | $0 | $279,200 |
| 2021 | $3,126 | $257,500 | $0 | $257,500 |
| 2020 | $3,349 | $269,400 | $0 | $269,400 |
| 2019 | $3,089 | $246,100 | $0 | $246,100 |
| 2018 | $3,151 | $236,200 | $0 | $236,200 |
| 2017 | $3,095 | $218,400 | $0 | $218,400 |
| 2016 | $2,845 | $198,100 | $0 | $198,100 |
| 2015 | $2,740 | $187,700 | $0 | $187,700 |
| 2014 | $2,467 | $166,000 | $0 | $166,000 |
Seller's Agent in 2024
Derek Wong
V & E Realty
(617) 290-8289
5 in this area
42 Total Sales
E
Buyer's Agent in 2024
Emily Cheung
V & E Realty
(617) 786-9399
1 in this area
2 Total Sales
J
Buyer's Agent in 2014
Jody Walsh
Success! Real Estate
S
Seller's Agent in 2013
Stephen Marcus
Associated Real Estate Partners, LLC
Source: MLS Property Information Network (MLS PIN)
MLS Number: 73243543
APN: QUIN-006159-000039-001208
Disclaimer: Certain information contained herein is derived from information provided by parties other than Homes.com. All information provided is deemed reliable, but is not guaranteed to be accurate and should be independently verified.
![]() The property listing data and information, or the Images, set forth herein were provided to MLS Property Information Network, Inc. from third party sources, including sellers, lessors and public records, and were compiled by MLS Property Information Network, Inc. The property listing data and information, and the Images, are for the personal, non-commercial use of consumers having a good faith interest in purchasing or leasing listed properties of the type displayed to them and may not be used for any purpose other than to identify prospective properties which such consumers may have a good faith interest in purchasing or leasing. MLS Property Information Network, Inc. and its subscribers disclaim any and all representations and warranties as to the accuracy of the property listing data and information, or as to the accuracy of any of the Images, set forth herein.
The property listing data and information, or the Images, set forth herein were provided to MLS Property Information Network, Inc. from third party sources, including sellers, lessors and public records, and were compiled by MLS Property Information Network, Inc. The property listing data and information, and the Images, are for the personal, non-commercial use of consumers having a good faith interest in purchasing or leasing listed properties of the type displayed to them and may not be used for any purpose other than to identify prospective properties which such consumers may have a good faith interest in purchasing or leasing. MLS Property Information Network, Inc. and its subscribers disclaim any and all representations and warranties as to the accuracy of the property listing data and information, or as to the accuracy of any of the Images, set forth herein.