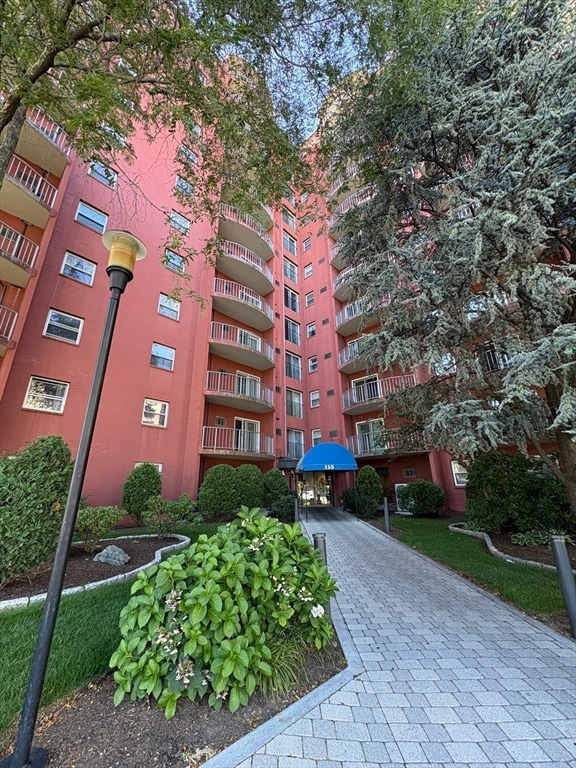
Sagamore Place Condominiums 115 W Squantum St Unit 907 Floor 9 Quincy, MA 02171
Montclair NeighborhoodEstimated payment $2,651/month
Highlights
- Medical Services
- In Ground Pool
- Jogging Path
- North Quincy High School Rated A
- Property is near public transit
- Elevator
About This Home
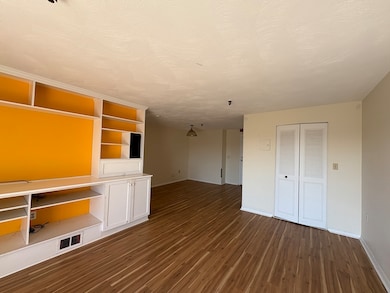
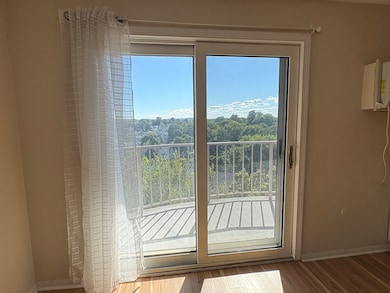
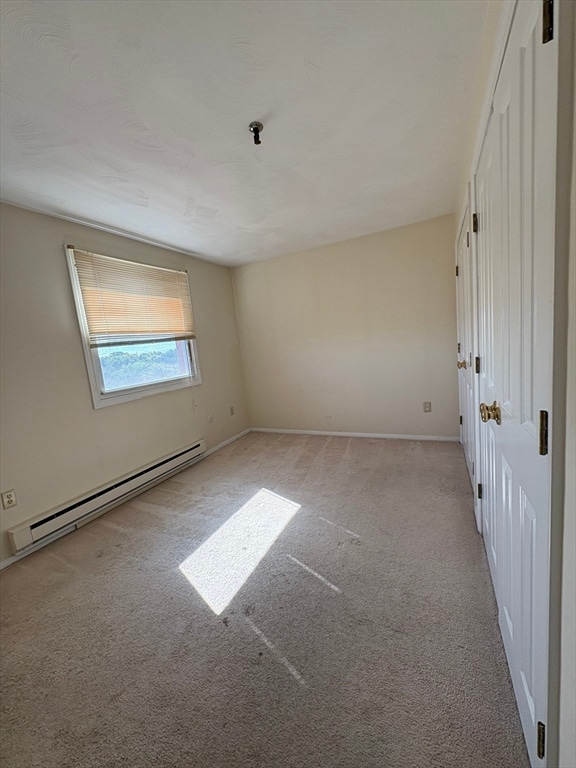
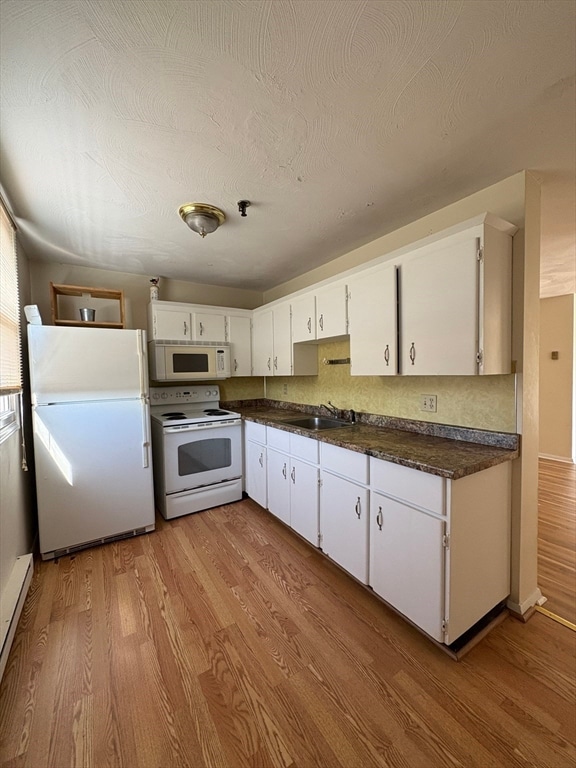
Highly desirable Sagamore Place Condo! Prime Location! Steps to North Quincy Red Line T station. Large one bedroom corner unit on 9th floor. Private balcony off large living room with beautiful Boston skyline and tons of natural sunlight. 2 yr old hot water heater. 1 assigned parking (#98) with plenty of visitor parking spaces. In-building laundry and 24 hour on-site management. Convenient to restaurants, shopping and schools, minutes to major highway. Sold as-is.
Property Details
Home Type
- Condominium
Est. Annual Taxes
- $3,565
Year Built
- Built in 1975
HOA Fees
- $434 Monthly HOA Fees
Home Design
- Entry on the 9th floor
Interior Spaces
- 765 Sq Ft Home
- 1-Story Property
Kitchen
- Range
- Microwave
Flooring
- Carpet
- Laminate
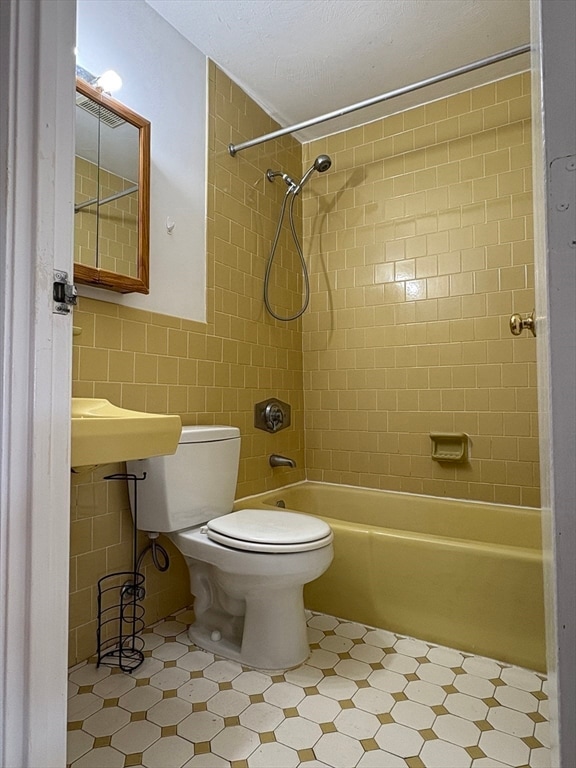
Bedrooms and Bathrooms
- 1 Bedroom
- 1 Full Bathroom
Parking
- 1 Car Parking Space
- Off-Street Parking
- Assigned Parking
Pool
- In Ground Pool
Location
- Property is near public transit
- Property is near schools
Utilities
- Cooling System Mounted In Outer Wall Opening
- 1 Cooling Zone
- 1 Heating Zone
- Electric Baseboard Heater
Listing and Financial Details
- Assessor Parcel Number 195868
Community Details
Overview
- Association fees include water, sewer, insurance, security, maintenance structure, road maintenance, ground maintenance, snow removal, trash
- 212 Units
- High-Rise Condominium
- Sagamore Towers Community
Amenities
- Medical Services
- Common Area
- Shops
- Coin Laundry
- Elevator
Recreation
- Community Pool
- Park
- Jogging Path
Security
- Resident Manager or Management On Site
Map
About Sagamore Place Condominiums
Home Values in the Area
Average Home Value in this Area
Tax History
| Year | Tax Paid | Tax Assessment Tax Assessment Total Assessment is a certain percentage of the fair market value that is determined by local assessors to be the total taxable value of land and additions on the property. | Land | Improvement |
|---|---|---|---|---|
| 2025 | $3,565 | $309,200 | $0 | $309,200 |
| 2024 | $3,352 | $297,400 | $0 | $297,400 |
| 2023 | $3,224 | $289,700 | $0 | $289,700 |
| 2022 | $3,345 | $279,200 | $0 | $279,200 |
| 2021 | $3,126 | $257,500 | $0 | $257,500 |
| 2020 | $3,349 | $269,400 | $0 | $269,400 |
| 2019 | $3,089 | $246,100 | $0 | $246,100 |
| 2018 | $3,151 | $236,200 | $0 | $236,200 |
| 2017 | $3,095 | $218,400 | $0 | $218,400 |
| 2016 | $2,845 | $198,100 | $0 | $198,100 |
| 2015 | $2,740 | $187,700 | $0 | $187,700 |
| 2014 | $2,467 | $166,000 | $0 | $166,000 |
Property History
| Date | Event | Price | List to Sale | Price per Sq Ft | Prior Sale |
|---|---|---|---|---|---|
| 11/05/2025 11/05/25 | Pending | -- | -- | -- | |
| 09/25/2025 09/25/25 | For Sale | $365,000 | 0.0% | $477 / Sq Ft | |
| 09/19/2025 09/19/25 | Pending | -- | -- | -- | |
| 09/08/2025 09/08/25 | For Sale | $365,000 | 0.0% | $477 / Sq Ft | |
| 08/23/2024 08/23/24 | Rented | $1,900 | -5.0% | -- | |
| 08/17/2024 08/17/24 | Under Contract | -- | -- | -- | |
| 08/12/2024 08/12/24 | For Rent | $2,000 | +8.1% | -- | |
| 08/17/2022 08/17/22 | Rented | $1,850 | -2.6% | -- | |
| 08/12/2022 08/12/22 | Under Contract | -- | -- | -- | |
| 07/08/2022 07/08/22 | For Rent | $1,900 | +18.8% | -- | |
| 07/12/2020 07/12/20 | Rented | $1,600 | 0.0% | -- | |
| 07/02/2020 07/02/20 | For Rent | $1,600 | 0.0% | -- | |
| 07/01/2020 07/01/20 | Under Contract | -- | -- | -- | |
| 06/18/2020 06/18/20 | For Rent | $1,600 | 0.0% | -- | |
| 06/05/2018 06/05/18 | Rented | $1,600 | 0.0% | -- | |
| 05/23/2018 05/23/18 | For Rent | $1,600 | 0.0% | -- | |
| 05/17/2018 05/17/18 | Under Contract | -- | -- | -- | |
| 05/01/2018 05/01/18 | For Rent | $1,600 | 0.0% | -- | |
| 02/12/2018 02/12/18 | Sold | $285,000 | -1.4% | $373 / Sq Ft | View Prior Sale |
| 01/26/2018 01/26/18 | Pending | -- | -- | -- | |
| 01/22/2018 01/22/18 | Price Changed | $289,000 | -2.0% | $378 / Sq Ft | |
| 12/15/2017 12/15/17 | For Sale | $294,900 | 0.0% | $385 / Sq Ft | |
| 04/23/2016 04/23/16 | Rented | $1,395 | 0.0% | -- | |
| 04/23/2016 04/23/16 | Under Contract | -- | -- | -- | |
| 04/07/2016 04/07/16 | Price Changed | $1,395 | -7.0% | $2 / Sq Ft | |
| 03/11/2016 03/11/16 | For Rent | $1,500 | +7.1% | -- | |
| 07/22/2015 07/22/15 | Rented | $1,400 | 0.0% | -- | |
| 07/22/2015 07/22/15 | For Rent | $1,400 | -- | -- |
Purchase History
| Date | Type | Sale Price | Title Company |
|---|---|---|---|
| Not Resolvable | $285,000 | -- | |
| Deed | $173,000 | -- |
Source: MLS Property Information Network (MLS PIN)
MLS Number: 73427675
APN: QUIN-006159-000039-000907
Disclaimer: Certain information contained herein is derived from information provided by parties other than Homes.com. All information provided is deemed reliable, but is not guaranteed to be accurate and should be independently verified.
![]() The property listing data and information, or the Images, set forth herein were provided to MLS Property Information Network, Inc. from third party sources, including sellers, lessors and public records, and were compiled by MLS Property Information Network, Inc. The property listing data and information, and the Images, are for the personal, non-commercial use of consumers having a good faith interest in purchasing or leasing listed properties of the type displayed to them and may not be used for any purpose other than to identify prospective properties which such consumers may have a good faith interest in purchasing or leasing. MLS Property Information Network, Inc. and its subscribers disclaim any and all representations and warranties as to the accuracy of the property listing data and information, or as to the accuracy of any of the Images, set forth herein.
The property listing data and information, or the Images, set forth herein were provided to MLS Property Information Network, Inc. from third party sources, including sellers, lessors and public records, and were compiled by MLS Property Information Network, Inc. The property listing data and information, and the Images, are for the personal, non-commercial use of consumers having a good faith interest in purchasing or leasing listed properties of the type displayed to them and may not be used for any purpose other than to identify prospective properties which such consumers may have a good faith interest in purchasing or leasing. MLS Property Information Network, Inc. and its subscribers disclaim any and all representations and warranties as to the accuracy of the property listing data and information, or as to the accuracy of any of the Images, set forth herein.
- 115 W Squantum St Unit 810
- 17 Holmes St Unit 2
- 17 Holmes St Unit 4
- 85 E Squantum St Unit 10
- 143 Arlington St
- 65 Barham Ave
- 60 Newbury St Unit 10
- 250 Fayette St
- 91 Atlantic St
- 68 Atlantic St
- 133 Commander Shea Blvd Unit 315
- 133 Commander Shea Blvd Unit 609
- 133 Commander Shea Blvd Unit 620
- 133 Commander Shea Blvd Unit 204
- 45 Hancock St Unit 203
- 11 Earle St
- 129-131 Pine St
- 90 Shore Ave
- 90 Quincy Shore Dr Unit 701
- 90 Quincy Shore Dr Unit 501
