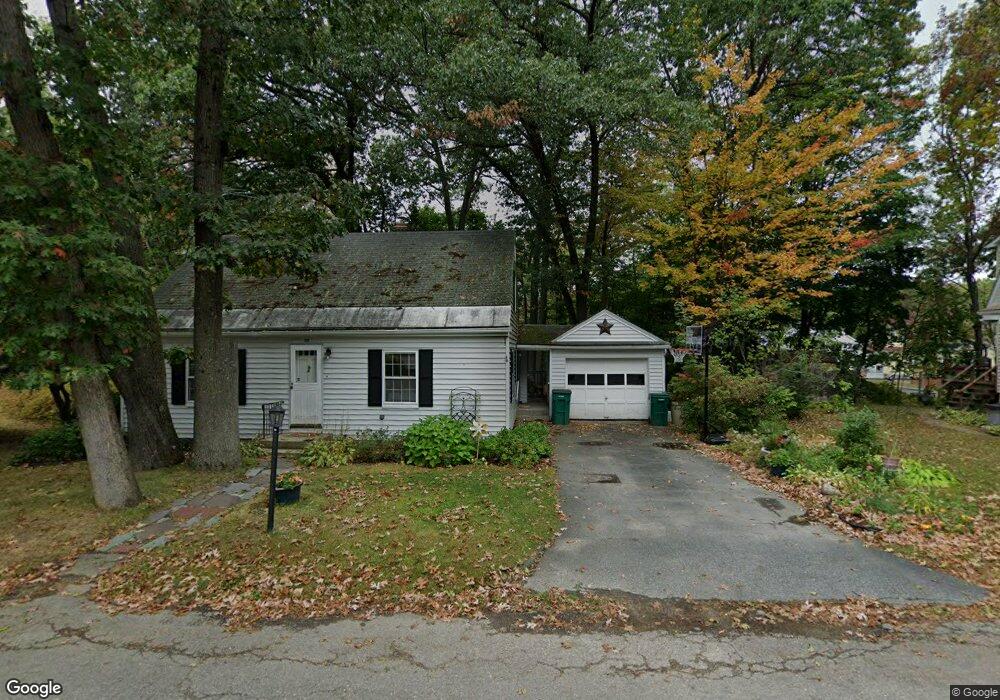
115 Warren St Fitchburg, MA 01420
Southside NeighborhoodEstimated Value: $299,000 - $393,000
3
Beds
2
Baths
1,344
Sq Ft
$274/Sq Ft
Est. Value
About This Home
This home is located at 115 Warren St, Fitchburg, MA 01420 and is currently estimated at $368,705, approximately $274 per square foot. 115 Warren St is a home located in Worcester County with nearby schools including South Street Elementary School, Reingold Elementary School, and Crocker Elementary School.
Ownership History
Date
Name
Owned For
Owner Type
Purchase Details
Closed on
Jan 18, 2005
Sold by
Shoesmith Ann L and Miller Charles F G
Bought by
Miller Katherine Ad
Current Estimated Value
Home Financials for this Owner
Home Financials are based on the most recent Mortgage that was taken out on this home.
Original Mortgage
$152,000
Outstanding Balance
$77,047
Interest Rate
5.81%
Mortgage Type
Purchase Money Mortgage
Estimated Equity
$291,658
Create a Home Valuation Report for This Property
The Home Valuation Report is an in-depth analysis detailing your home's value as well as a comparison with similar homes in the area
Home Values in the Area
Average Home Value in this Area
Purchase History
| Date | Buyer | Sale Price | Title Company |
|---|---|---|---|
| Miller Katherine Ad | $160,000 | -- |
Source: Public Records
Mortgage History
| Date | Status | Borrower | Loan Amount |
|---|---|---|---|
| Open | Miller Katherine Ad | $152,000 |
Source: Public Records
Tax History Compared to Growth
Tax History
| Year | Tax Paid | Tax Assessment Tax Assessment Total Assessment is a certain percentage of the fair market value that is determined by local assessors to be the total taxable value of land and additions on the property. | Land | Improvement |
|---|---|---|---|---|
| 2025 | $44 | $325,800 | $103,700 | $222,100 |
| 2024 | $4,199 | $283,500 | $68,700 | $214,800 |
| 2023 | $4,059 | $253,400 | $60,100 | $193,300 |
| 2022 | $3,703 | $210,300 | $51,500 | $158,800 |
| 2021 | $3,616 | $190,000 | $41,700 | $148,300 |
| 2020 | $7,225 | $180,100 | $39,300 | $140,800 |
| 2019 | $6,697 | $164,400 | $52,800 | $111,600 |
| 2018 | $3,240 | $154,200 | $50,300 | $103,900 |
| 2017 | $6,352 | $141,100 | $50,300 | $90,800 |
| 2016 | $2,913 | $137,200 | $45,400 | $91,800 |
| 2015 | $2,831 | $136,900 | $46,600 | $90,300 |
| 2014 | $2,713 | $136,800 | $46,600 | $90,200 |
Source: Public Records
Map
Nearby Homes
- 116 Pine St
- 17 Henry St
- 32 Clifton St
- 559 Milk St
- 16 Otis St
- 10-12 Otis St
- 375 Rollstone St
- 16 Thomas St
- 132 Hazel St
- 505 Old South St
- 9 Brigham St
- 535 South St Unit 4-2A
- 535 South St Unit 14-2A
- 48 Silver St
- 0 Franklin Rd-Lots1-7 Unit 72947330
- 12 Washington St
- 38-44 Granite St
- 19 Mount Carmel St
- 133-137 Laurel St
- 179 Pratt St