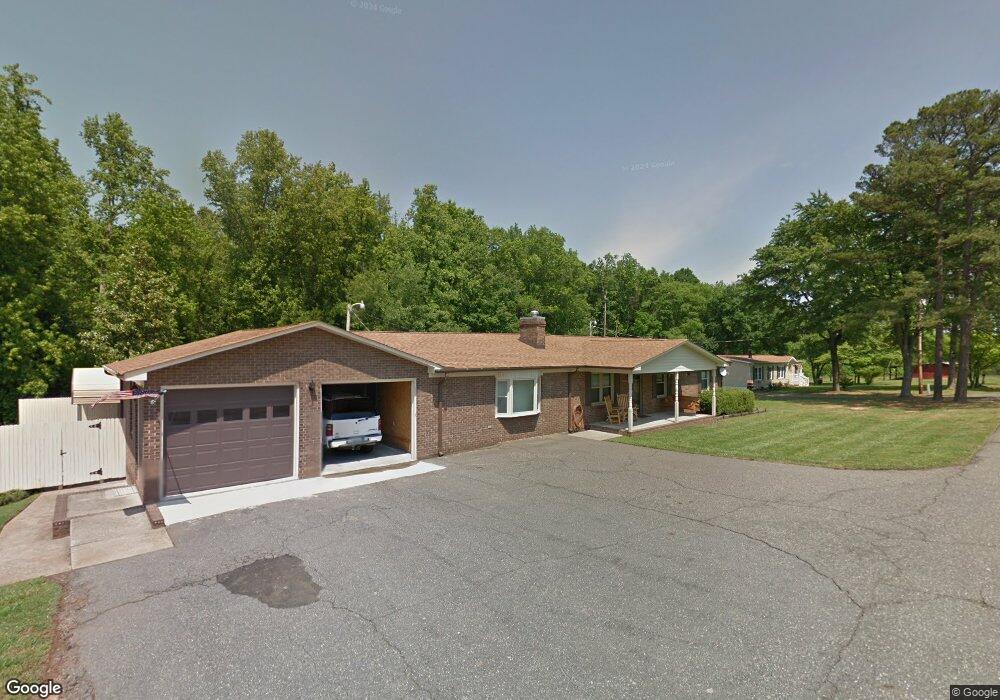
115 White Pine Dr Dallas, NC 28034
Estimated Value: $319,522 - $370,000
2
Beds
2
Baths
2,200
Sq Ft
$157/Sq Ft
Est. Value
About This Home
This home is located at 115 White Pine Dr, Dallas, NC 28034 and is currently estimated at $346,381, approximately $157 per square foot. 115 White Pine Dr is a home located in Gaston County with nearby schools including Carr Elementary School, W.C. Friday Middle School, and North Gaston High School.
Ownership History
Date
Name
Owned For
Owner Type
Purchase Details
Closed on
Nov 19, 2024
Sold by
Morris Debra Ann and Morris Clarence Villian
Bought by
Clarence And Debra Morris Living Trust and Morris
Current Estimated Value
Purchase Details
Closed on
Jul 8, 2009
Sold by
Morris Clarence V and Morris Debra M
Bought by
Morris Clarence and Morris Debra M
Purchase Details
Closed on
Jul 1, 2009
Sold by
Cloninger Kenneth K and Cloninger Gloria
Bought by
Morris Clarence and Morris Debra M
Purchase Details
Closed on
Jun 30, 2009
Sold by
Cloninger Carrie R
Bought by
Morris Clarence and Morris Debra M
Purchase Details
Closed on
Apr 28, 2009
Sold by
Morris Michael L and Morris Dawn Marie B
Bought by
Morris Clarence and Morris Debra Ann
Purchase Details
Closed on
Sep 22, 2006
Sold by
Morris Clarence V and Morris Debra Ann
Bought by
Morris Michael L
Create a Home Valuation Report for This Property
The Home Valuation Report is an in-depth analysis detailing your home's value as well as a comparison with similar homes in the area
Home Values in the Area
Average Home Value in this Area
Purchase History
| Date | Buyer | Sale Price | Title Company |
|---|---|---|---|
| Clarence And Debra Morris Living Trust | -- | None Listed On Document | |
| Clarence And Debra Morris Living Trust | -- | None Listed On Document | |
| Morris Clarence | -- | Chicago Title Insurance Co | |
| Morris Clarence | $45,000 | Chicago Title Insurance Co | |
| Morris Clarence | $5,000 | Chicago Title Insurance Co | |
| Morris Clarence | -- | Chicago Title Insurance Co | |
| Morris Michael L | -- | None Available |
Source: Public Records
Tax History Compared to Growth
Tax History
| Year | Tax Paid | Tax Assessment Tax Assessment Total Assessment is a certain percentage of the fair market value that is determined by local assessors to be the total taxable value of land and additions on the property. | Land | Improvement |
|---|---|---|---|---|
| 2025 | $1,660 | $232,460 | $25,880 | $206,580 |
| 2024 | $1,660 | $232,460 | $25,880 | $206,580 |
| 2023 | $1,616 | $232,460 | $25,880 | $206,580 |
| 2022 | $1,758 | $191,080 | $15,500 | $175,580 |
| 2021 | $1,800 | $191,080 | $15,500 | $175,580 |
| 2019 | $1,781 | $191,080 | $15,500 | $175,580 |
| 2018 | $1,406 | $149,054 | $17,388 | $131,666 |
| 2017 | $1,409 | $149,383 | $17,388 | $131,995 |
| 2016 | $1,409 | $149,383 | $0 | $0 |
| 2014 | $1,537 | $164,684 | $20,280 | $144,404 |
Source: Public Records
Map
Nearby Homes
- 4618 Dallas High Shoals Hwy
- 1819 Ratchford Dr
- 3501 Cinderella Dr Unit 7
- 3508 Merry Oaks Ln
- 3514 Merry Oaks Ln
- 4040 Hereford Ln
- 601 Elmwood Cir
- 4016 Hereford Ln
- 1001 College Blvd
- 00 Summey Farm Dr
- 2017 Longhorn Dr
- 5606 Katherine Ct
- 111 Summey Barker Dr
- 912 Carole Summey Dr
- 1274 Carpenter Springs Dr
- 109 Churchill Rd
- 5117 Park Place Dr
- 000 Dallas Cherryville Hwy
- 6103 Dane Dr
- 600 Summey Farm Dr
- 119 White Pine Dr
- 105 Smith Grooms Hollow
- 114 White Pine Dr
- 4304 Dallas High Shoals Hwy
- 130 White Pine Dr
- 130 Whiteside Ave
- 1015 Ashebrook Park Rd
- 4301 Dallas High Shoals Hwy
- 4114 Dallas High Shoals Hwy
- 4406 Dallas High Shoals Hwy
- 4305 Dallas High Shoals Hwy
- 707 Hester Dr Unit 7
- 705 Hester Dr
- 4401 Dallas High Shoals Hwy
- 607 Hester Dr
- 709 Hester Dr
- 703 Hester Dr
- 603 Hester Dr
- 4106 Dallas High Shoals Hwy
- 1007 Ashebrook Park Rd