Estimated Value: $18,000 - $146,000
--
Bed
--
Bath
--
Sq Ft
0.6
Acres
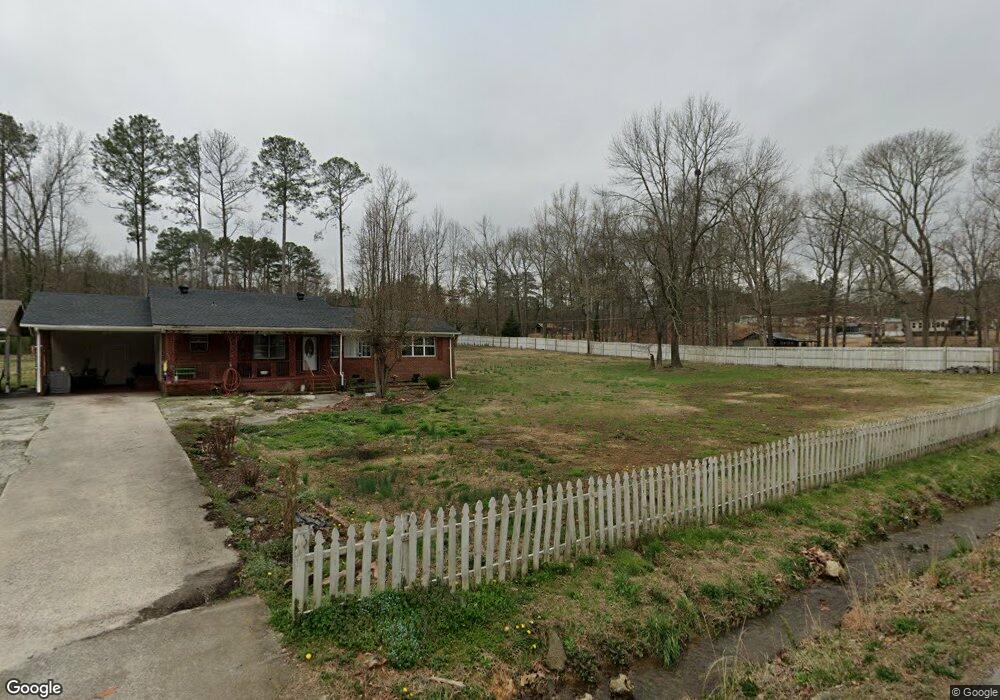
About This Home
This home is located at 115 Wilkerson Rd SW, Rome, GA 30165 and is currently estimated at $72,667. 115 Wilkerson Rd SW is a home located in Floyd County with nearby schools including Coosa Middle School, Coosa High School, and Darlington School.
Ownership History
Date
Name
Owned For
Owner Type
Purchase Details
Closed on
May 15, 2015
Sold by
Givens James M
Bought by
Reyes Jose L and Reyes Darlin
Current Estimated Value
Purchase Details
Closed on
Jan 10, 2013
Sold by
Hall Annette B
Bought by
Givens James M
Purchase Details
Closed on
Apr 18, 2007
Sold by
Not Provided
Bought by
Hall Hall Annette B Annette B and Hall Lester M
Purchase Details
Closed on
Jan 29, 1998
Sold by
Drummond Glenn L As Executor U/W Of Este
Bought by
Hall Annette B
Purchase Details
Closed on
Jan 20, 1998
Bought by
P and R
Purchase Details
Closed on
Jan 12, 1998
Bought by
P and R
Purchase Details
Closed on
Jan 7, 1998
Bought by
P and R
Purchase Details
Closed on
May 28, 1997
Sold by
Drummond Esther
Bought by
Drummond Glenn L As Executor U/W Of Este
Purchase Details
Closed on
Jan 12, 1997
Bought by
P and R
Purchase Details
Closed on
Feb 22, 1966
Sold by
P\R
Bought by
Drummond Esther
Purchase Details
Closed on
Feb 2, 1966
Bought by
P\R
Create a Home Valuation Report for This Property
The Home Valuation Report is an in-depth analysis detailing your home's value as well as a comparison with similar homes in the area
Home Values in the Area
Average Home Value in this Area
Purchase History
| Date | Buyer | Sale Price | Title Company |
|---|---|---|---|
| Reyes Jose L | $8,000 | -- | |
| Givens James M | -- | -- | |
| Hall Hall Annette B Annette B | -- | -- | |
| Hall Annette B | $1,500 | -- | |
| Hall Annette B | -- | -- | |
| P | $1,500 | -- | |
| P | $1,500 | -- | |
| P | $1,500 | -- | |
| Drummond Glenn L As Executor U/W Of Este | -- | -- | |
| P | $1,500 | -- | |
| Drummond Esther | -- | -- | |
| P\R | -- | -- |
Source: Public Records
Tax History Compared to Growth
Tax History
| Year | Tax Paid | Tax Assessment Tax Assessment Total Assessment is a certain percentage of the fair market value that is determined by local assessors to be the total taxable value of land and additions on the property. | Land | Improvement |
|---|---|---|---|---|
| 2024 | $140 | $4,435 | $4,435 | $0 |
| 2023 | $127 | $4,032 | $4,032 | $0 |
| 2022 | $96 | $3,226 | $3,226 | $0 |
| 2021 | $97 | $3,226 | $3,226 | $0 |
| 2020 | $74 | $2,419 | $2,419 | $0 |
| 2019 | $73 | $2,419 | $2,419 | $0 |
| 2018 | $73 | $2,419 | $2,419 | $0 |
| 2017 | $73 | $2,419 | $2,419 | $0 |
| 2016 | $156 | $5,128 | $2,400 | $2,728 |
| 2015 | $153 | $5,128 | $2,400 | $2,728 |
| 2014 | $153 | $5,128 | $2,400 | $2,728 |
Source: Public Records
Map
Nearby Homes
- 17 Wilkerson Rd SW
- 16 Wilkerson Rd SW
- 50 Melton Ave SW
- 3 Pebble Bend Ct
- 0 Mount Alto Rd SW Unit 10523740
- 13 Ridgewood Rd SW
- 2 Wayne St SW
- 27 Bluff Mountain Dr SW
- 110 Williamson St SW
- 4 Wayne St SW
- 14 Berckman Ln SW
- 438 Wilkerson Rd SW
- 3 Berckman Ln SW
- 19 Berckman Ln SW
- 506 Wilkerson Rd SW
- 8 S Hughes St SW
- 40 Paris Dr SW
- 8 Leon St SW
- 40 Hawk Spring Dr SW
- 17 Rosewood Rd SW
- 111 Wilkerson Rd SW
- 111 Wilkerson Rd SW
- 200 Wilkerson Rd SW
- 167 Drummond Dr SW
- 103 Wilkerson Rd SW
- 202 Wilkerson Rd SW
- 140 Drummond Dr SW
- 203 S Sycamore St SW
- 203 S Sycamore St SW
- 203 S Sycamore St SW
- 203 S Sycamore St SW
- 203 S Sycamore St SW
- 104 Wilkerson Rd SW
- 104 Wilkerson Rd SW
- 207 Wilkerson Rd SW
- 204 Wilkerson Rd SW
- 2 Kennemore Rd SW
- 10 Kennemore Rd SW
- 209 Wilkerson Rd SW
- 6 Kennemore Rd SW