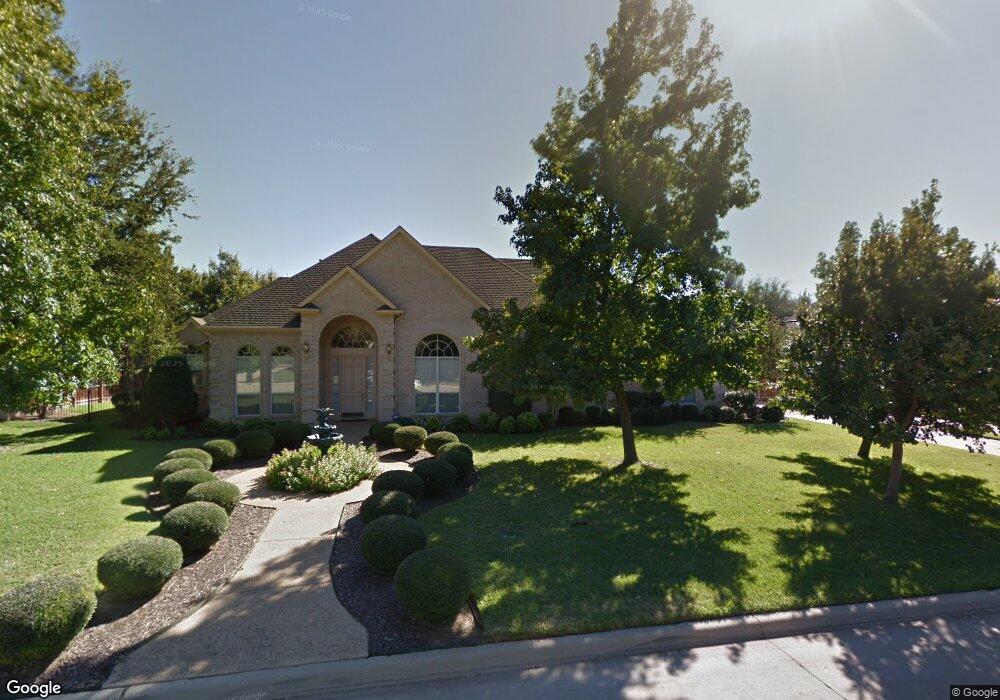
115 Yale Dr Southlake, TX 76092
Estimated Value: $1,196,621 - $1,409,000
4
Beds
3
Baths
3,822
Sq Ft
$337/Sq Ft
Est. Value
About This Home
This home is located at 115 Yale Dr, Southlake, TX 76092 and is currently estimated at $1,287,405, approximately $336 per square foot. 115 Yale Dr is a home located in Tarrant County with nearby schools including Robert High Rockenbaugh Elementary School, Eubanks Intermediate School, and George Dawson Middle School.
Ownership History
Date
Name
Owned For
Owner Type
Purchase Details
Closed on
Mar 15, 1996
Sold by
Fred D Williams Inc
Bought by
Agnihotri Ashok and Agnihotri Meera
Current Estimated Value
Home Financials for this Owner
Home Financials are based on the most recent Mortgage that was taken out on this home.
Original Mortgage
$207,000
Outstanding Balance
$14,590
Interest Rate
7.02%
Mortgage Type
Construction
Estimated Equity
$1,272,815
Purchase Details
Closed on
Mar 14, 1996
Sold by
Sunnybrook Properties Inc
Bought by
Fred D Williams Inc
Home Financials for this Owner
Home Financials are based on the most recent Mortgage that was taken out on this home.
Original Mortgage
$207,000
Outstanding Balance
$14,590
Interest Rate
7.02%
Mortgage Type
Construction
Estimated Equity
$1,272,815
Create a Home Valuation Report for This Property
The Home Valuation Report is an in-depth analysis detailing your home's value as well as a comparison with similar homes in the area
Home Values in the Area
Average Home Value in this Area
Purchase History
| Date | Buyer | Sale Price | Title Company |
|---|---|---|---|
| Agnihotri Ashok | -- | First American Title Co | |
| Fred D Williams Inc | -- | First American Title Co |
Source: Public Records
Mortgage History
| Date | Status | Borrower | Loan Amount |
|---|---|---|---|
| Open | Agnihotri Ashok | $207,000 | |
| Closed | Agnihotri Ashok | $41,000 |
Source: Public Records
Tax History Compared to Growth
Tax History
| Year | Tax Paid | Tax Assessment Tax Assessment Total Assessment is a certain percentage of the fair market value that is determined by local assessors to be the total taxable value of land and additions on the property. | Land | Improvement |
|---|---|---|---|---|
| 2025 | $6,825 | $1,141,893 | $344,325 | $797,568 |
| 2024 | $6,825 | $1,141,893 | $344,325 | $797,568 |
| 2023 | $16,520 | $965,702 | $344,325 | $621,377 |
| 2022 | $17,776 | $942,867 | $229,550 | $713,317 |
| 2021 | $17,078 | $757,829 | $229,550 | $528,279 |
| 2020 | $15,652 | $680,949 | $206,595 | $474,354 |
| 2019 | $16,873 | $696,804 | $150,000 | $546,804 |
| 2018 | $10,351 | $692,492 | $150,000 | $542,492 |
| 2017 | $17,044 | $687,639 | $150,000 | $537,639 |
| 2016 | $15,545 | $656,672 | $150,000 | $506,672 |
| 2015 | $10,116 | $600,635 | $65,000 | $535,635 |
| 2014 | $10,116 | $518,300 | $65,000 | $453,300 |
Source: Public Records
Map
Nearby Homes
- 802 Princeton Ct
- 900 Kingsbury Way
- 305 Canyon Lake Dr
- 800 Woodcrest Ct
- 806 Shadow Glen Dr
- 1196 W Continental Blvd
- 608 Stratford Dr
- 806 Ridgedale Ct
- 205 Edinburgh Ct
- 351 S White Chapel Blvd
- 221 Pine Dr
- 7607 Monticello Pkwy
- 1206 Oakwood Trail
- 1002 Chimney Hill Trail
- 102 Springbrook Ct
- 1227 Strathmore Dr
- 305 Sheffield Dr
- 7702 Tillman Hill Rd
- 7511 Mount Vernon Dr
- 7312 Hix Ct
- 113 Yale Dr
- 117 Yale Dr
- 114 Wilmington Ct
- 112 Wilmington Ct
- 116 Yale Dr
- 116 Wilmington Ct
- 908 Columbia Dr
- 114 Yale Dr
- 111 Yale Dr
- 904 Columbia Dr
- 110 Wilmington Ct
- 112 Yale Dr
- 118 Wilmington Ct
- 907 Edgemeer Ln
- 905 Edgemeer Ln
- 109 Yale Dr
- 115 Wilmington Ct
- 113 Wilmington Ct
- 108 Wilmington Ct
- 902 Columbia Dr