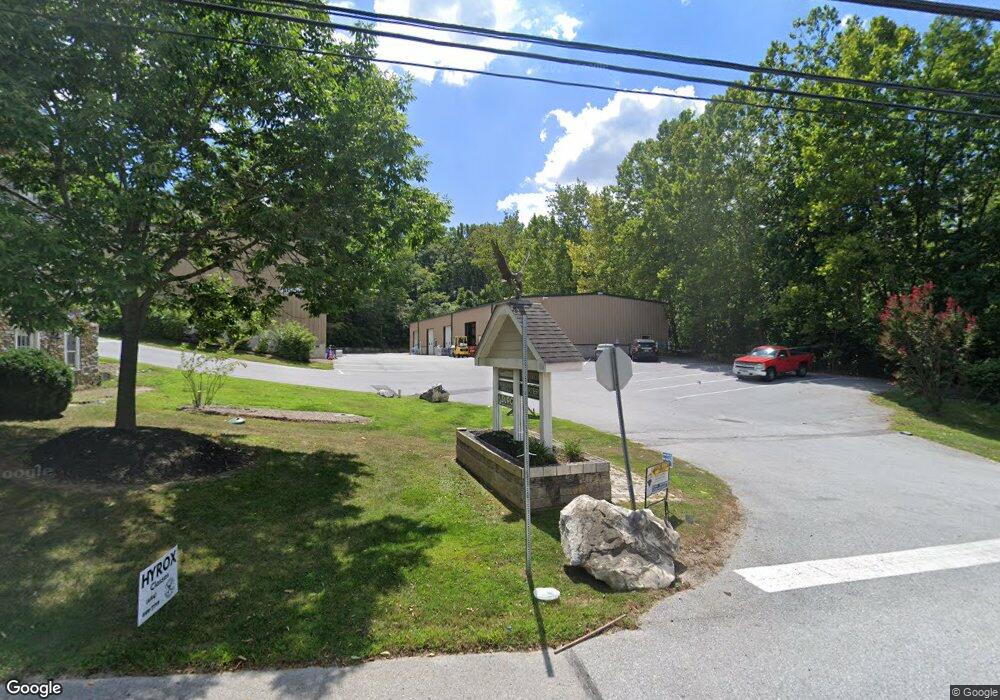
1150 Boot Rd Unit MULTI Downingtown, PA 19335
East Caln NeighborhoodEstimated Value: $905,638
2
Beds
1
Bath
23,926
Sq Ft
$38/Sq Ft
Est. Value
About This Home
This home is located at 1150 Boot Rd Unit MULTI, Downingtown, PA 19335 and is currently estimated at $905,638, approximately $37 per square foot. 1150 Boot Rd Unit MULTI is a home located in Chester County with nearby schools including Beaver Creek Elementary School, Downingtown Middle School, and Downingtown High School West.
Ownership History
Date
Name
Owned For
Owner Type
Purchase Details
Closed on
Aug 25, 2010
Sold by
Mcnabb Michael
Bought by
Mcnabb Michael
Current Estimated Value
Purchase Details
Closed on
Jan 13, 2009
Sold by
Mcnabb Michael
Bought by
Mcnabb Michael
Purchase Details
Closed on
Oct 15, 2007
Sold by
Amended Richard and Amended Jeanette Merion
Bought by
Mcnabb Michael
Home Financials for this Owner
Home Financials are based on the most recent Mortgage that was taken out on this home.
Original Mortgage
$450,000
Outstanding Balance
$285,038
Interest Rate
6.49%
Mortgage Type
Seller Take Back
Estimated Equity
$617,180
Purchase Details
Closed on
May 31, 2005
Sold by
Merion Richard D and Merion Jeanette T
Bought by
Merion Richard D and Merion Jeanette T
Create a Home Valuation Report for This Property
The Home Valuation Report is an in-depth analysis detailing your home's value as well as a comparison with similar homes in the area
Home Values in the Area
Average Home Value in this Area
Purchase History
| Date | Buyer | Sale Price | Title Company |
|---|---|---|---|
| Mcnabb Michael | -- | None Available | |
| Mcnabb Michael | -- | None Available | |
| Mcnabb Michael | -- | None Available | |
| Mcnabb Michael | $550,000 | None Available | |
| Merion Richard D | -- | -- |
Source: Public Records
Mortgage History
| Date | Status | Borrower | Loan Amount |
|---|---|---|---|
| Open | Mcnabb Michael | $450,000 |
Source: Public Records
Tax History
| Year | Tax Paid | Tax Assessment Tax Assessment Total Assessment is a certain percentage of the fair market value that is determined by local assessors to be the total taxable value of land and additions on the property. | Land | Improvement |
|---|---|---|---|---|
| 2025 | $18,333 | $518,470 | $187,580 | $330,890 |
| 2024 | $18,333 | $518,470 | $187,580 | $330,890 |
| 2023 | $17,814 | $518,470 | $187,580 | $330,890 |
| 2022 | $17,383 | $518,470 | $187,580 | $330,890 |
| 2021 | $17,101 | $518,470 | $187,580 | $330,890 |
| 2020 | $17,006 | $518,470 | $187,580 | $330,890 |
| 2019 | $17,006 | $518,470 | $187,580 | $330,890 |
| 2018 | $17,006 | $518,470 | $187,580 | $330,890 |
| 2017 | $17,006 | $518,470 | $187,580 | $330,890 |
| 2016 | $10,555 | $518,470 | $187,580 | $330,890 |
| 2015 | $10,555 | $518,470 | $187,580 | $330,890 |
| 2014 | $10,555 | $518,470 | $187,580 | $330,890 |
Source: Public Records
Map
Nearby Homes
- 141 Four Leaf Dr
- 1016 W Boot Rd
- 1288 Copeland School Rd
- 554 W Boot Rd
- 524 E Saxony Dr Unit 524
- 234 Whiteland Ave
- 1430 Grove Ave
- 1432 Grove Ave
- 1556 S Whitford Rd
- 26 Mcilvain Dr
- 1 Adams Ln
- 357 Jefferson Ave
- 609 Thomas Rd
- 447 Lee Place
- 435 Chesterfield Dr
- 149 Lake Dr
- 335 E Lancaster Ave Unit A-10
- 270 W Uwchlan Ave Unit 56
- 419 Sunset Dr
- 236 Silverbell Ct
- 1150 Boot Rd
- 1150 Boot Rd Unit 4
- 147 Four Leaf Dr
- 149 Four Leaf Dr
- 143 Four Leaf Dr
- 6 Shamrock Cir
- 8 Shamrock Cir
- 10 Shamrock Cir
- 14 Shamrock Cir
- 18 Shamrock Cir
- 1080 Boot Rd
- 20 Shamrock Cir
- 1070 Old Boot Rd
- 123 Four Leaf Dr
- 121 Four Leaf Dr
- 117 Four Leaf Dr
- 115 Four Leaf Dr
- 113 Four Leaf Dr
- 111 Four Leaf Dr
- 66 Four Leaf Dr
Your Personal Tour Guide
Ask me questions while you tour the home.