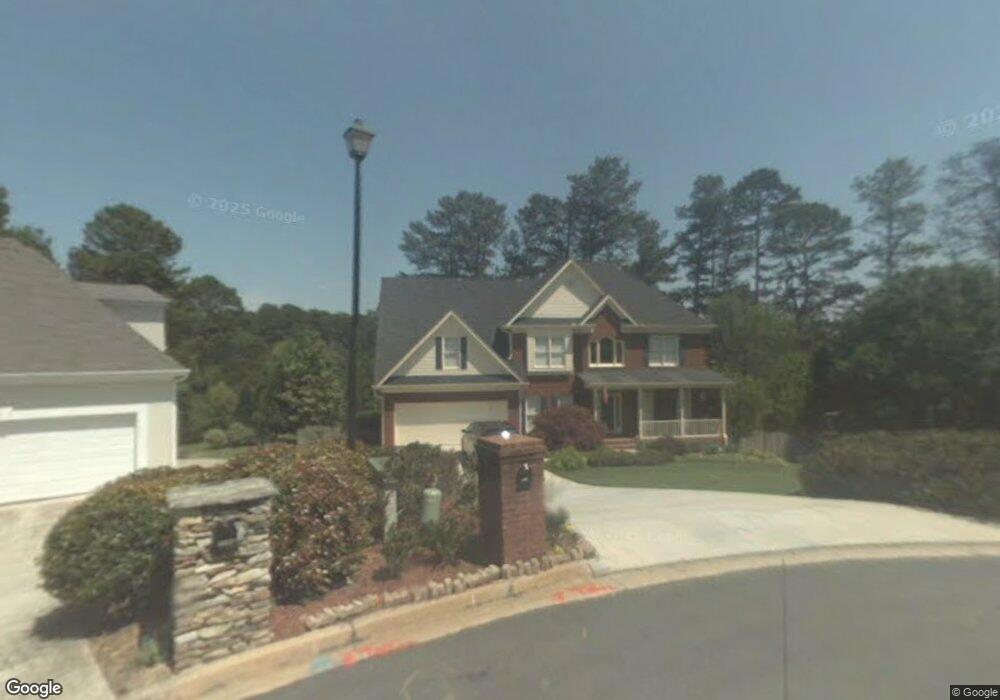
1150 Castle Pointe Ln Grayson, GA 30017
Estimated Value: $518,781 - $564,000
5
Beds
4
Baths
3,554
Sq Ft
$151/Sq Ft
Est. Value
About This Home
This home is located at 1150 Castle Pointe Ln, Grayson, GA 30017 and is currently estimated at $537,195, approximately $151 per square foot. 1150 Castle Pointe Ln is a home located in Gwinnett County with nearby schools including Pharr Elementary School, Couch Middle School, and Grayson High School.
Ownership History
Date
Name
Owned For
Owner Type
Purchase Details
Closed on
May 28, 2010
Sold by
Federal Natl Mtg Assn Fnma
Bought by
Duncan Corey S and Duncan Whitney H
Current Estimated Value
Home Financials for this Owner
Home Financials are based on the most recent Mortgage that was taken out on this home.
Original Mortgage
$153,600
Outstanding Balance
$102,303
Interest Rate
5%
Mortgage Type
New Conventional
Estimated Equity
$434,892
Purchase Details
Closed on
Oct 6, 2009
Sold by
Suntrust Mtg Inc
Bought by
Federal Natl Mtg Assn Fnma
Purchase Details
Closed on
Jul 27, 2006
Sold by
Hannon Cary A and Hannon Sherri A
Bought by
Herring Felisa A
Home Financials for this Owner
Home Financials are based on the most recent Mortgage that was taken out on this home.
Original Mortgage
$287,100
Interest Rate
6.6%
Mortgage Type
New Conventional
Create a Home Valuation Report for This Property
The Home Valuation Report is an in-depth analysis detailing your home's value as well as a comparison with similar homes in the area
Home Values in the Area
Average Home Value in this Area
Purchase History
| Date | Buyer | Sale Price | Title Company |
|---|---|---|---|
| Duncan Corey S | $192,000 | -- | |
| Federal Natl Mtg Assn Fnma | -- | -- | |
| Suntrust Mtg Inc | $308,976 | -- | |
| Herring Felisa A | $358,900 | -- |
Source: Public Records
Mortgage History
| Date | Status | Borrower | Loan Amount |
|---|---|---|---|
| Open | Duncan Corey S | $153,600 | |
| Previous Owner | Herring Felisa A | $287,100 |
Source: Public Records
Tax History
| Year | Tax Paid | Tax Assessment Tax Assessment Total Assessment is a certain percentage of the fair market value that is determined by local assessors to be the total taxable value of land and additions on the property. | Land | Improvement |
|---|---|---|---|---|
| 2025 | $5,779 | $201,960 | $43,000 | $158,960 |
| 2024 | $5,824 | $197,120 | $43,000 | $154,120 |
| 2023 | $5,824 | $187,720 | $45,840 | $141,880 |
| 2022 | $5,298 | $173,120 | $40,640 | $132,480 |
| 2021 | $4,681 | $139,560 | $35,840 | $103,720 |
| 2020 | $4,541 | $131,600 | $32,440 | $99,160 |
| 2019 | $4,399 | $131,600 | $32,440 | $99,160 |
| 2018 | $3,977 | $111,840 | $29,840 | $82,000 |
| 2016 | $3,507 | $96,680 | $23,840 | $72,840 |
| 2015 | $3,546 | $96,680 | $23,840 | $72,840 |
| 2014 | -- | $90,560 | $23,840 | $66,720 |
Source: Public Records
Map
Nearby Homes
- 1729 Pinehurst View Ct
- 986 Lakeview Oaks Ct Unit 26-B
- 986 Lakeview Oaks Ct
- 1306 Annapolis Way
- 1855 Big Haynes Ct Unit 7
- 1860 Pinehurst View Dr
- 1210 Hogan Ridge Dr
- 1404 Hattiesburg Ct
- 1470 Highland Lake Dr
- 1445 Hillside Dr SW
- 1429 Lakeview Rd
- 621 Pineberry Ct
- 1476 Annapolis Way
- 1430 Roanoke Trace
- 917 Mount Mckinley Way
- 1453 Amber Hill Ln
- 1955 Lakewood Trace
- 1405 Wilmington Way Unit 4
- 1670 Cooper Lakes Dr
- 1467 Oak Bend Way
- 1160 Castle Pointe Ln
- 1140 Castle Pointe Ln
- 1590 Pinehurst View Dr
- 1170 Castle Pointe Ln Unit 1
- 1130 Castle Pointe Ln
- 1580 Pinehurst View Dr
- 1600 Pinehurst View Dr
- 1175 Castle Pointe Ln
- 1180 Castle Pointe Ln Unit 1
- 1120 Castle Pointe Ln
- 1570 Pinehurst View Dr
- 1185 Castle Pointe Ln Unit 20
- 1185 Castle Pointe Ln
- 1610 Pinehurst View Dr Unit V
- 1115 Castle Pointe Ln
- 1115 Castle Pointe Ln Unit 1
- 1110 Castle Pointe Ln
- 1190 Castle Pointe Ln
- 1560 Pinehurst View Dr
- 1615 Pinehurst View Dr Unit V
Your Personal Tour Guide
Ask me questions while you tour the home.