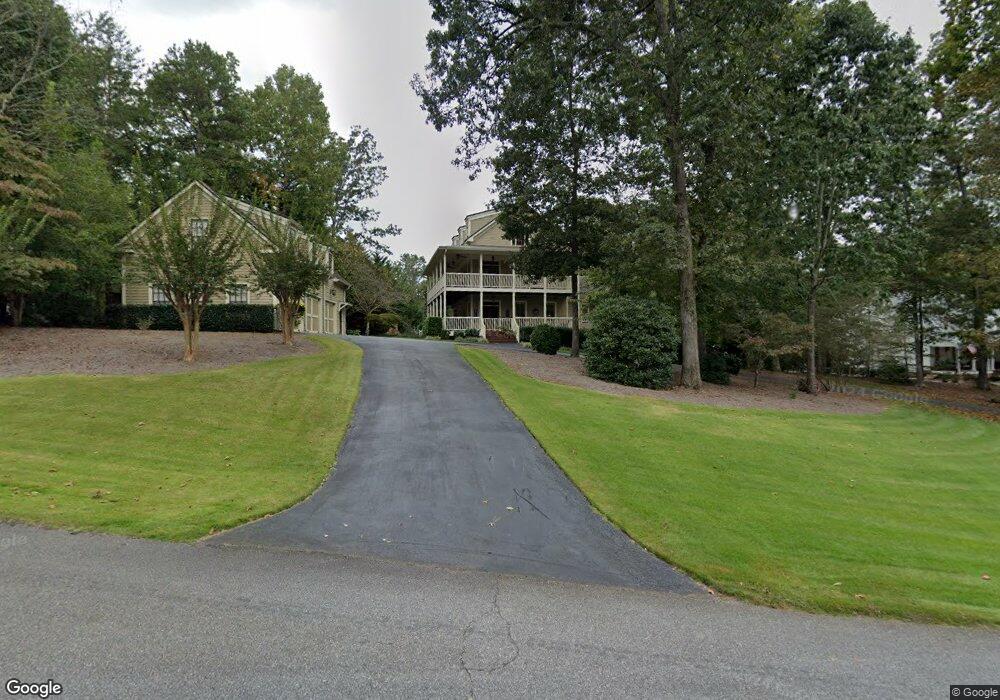
1150 Dogwood Way Dawsonville, GA 30534
Dawson County NeighborhoodEstimated Value: $796,000 - $901,000
3
Beds
4
Baths
3,164
Sq Ft
$269/Sq Ft
Est. Value
About This Home
This home is located at 1150 Dogwood Way, Dawsonville, GA 30534 and is currently estimated at $849,904, approximately $268 per square foot. 1150 Dogwood Way is a home located in Dawson County with nearby schools including Kilough Elementary School, Dawson County Junior High School, and Dawson County Middle School.
Ownership History
Date
Name
Owned For
Owner Type
Purchase Details
Closed on
Oct 21, 2011
Bought by
Foster Norman Mark
Current Estimated Value
Home Financials for this Owner
Home Financials are based on the most recent Mortgage that was taken out on this home.
Original Mortgage
$247,500
Outstanding Balance
$169,292
Interest Rate
4.16%
Mortgage Type
New Conventional
Estimated Equity
$680,612
Purchase Details
Closed on
Jun 7, 2011
Sold by
Community
Bought by
Community
Purchase Details
Closed on
Feb 5, 2008
Sold by
Bentley Sonny L
Bought by
Pearson James J
Purchase Details
Closed on
Aug 16, 2002
Sold by
Bentley Sonny L
Bought by
Bentley Sonny L and Bentley Susan W
Purchase Details
Closed on
Oct 27, 1999
Sold by
Chestatee Developmen
Bought by
Bentley Sonny L
Purchase Details
Closed on
Sep 30, 1996
Sold by
Byste Inc
Bought by
Chestatee Developmen
Create a Home Valuation Report for This Property
The Home Valuation Report is an in-depth analysis detailing your home's value as well as a comparison with similar homes in the area
Home Values in the Area
Average Home Value in this Area
Purchase History
| Date | Buyer | Sale Price | Title Company |
|---|---|---|---|
| Foster Norman Mark | $275,000 | -- | |
| Community | $365,000 | -- | |
| Pearson James J | $405,000 | -- | |
| Bentley Sonny L | -- | -- | |
| Bentley Sonny L | -- | -- | |
| Chestatee Developmen | -- | -- |
Source: Public Records
Mortgage History
| Date | Status | Borrower | Loan Amount |
|---|---|---|---|
| Open | Community | $247,500 |
Source: Public Records
Tax History Compared to Growth
Tax History
| Year | Tax Paid | Tax Assessment Tax Assessment Total Assessment is a certain percentage of the fair market value that is determined by local assessors to be the total taxable value of land and additions on the property. | Land | Improvement |
|---|---|---|---|---|
| 2024 | $4,044 | $301,080 | $50,000 | $251,080 |
| 2023 | $4,864 | $288,920 | $50,000 | $238,920 |
| 2022 | $4,838 | $225,840 | $32,000 | $193,840 |
| 2021 | $4,355 | $192,480 | $32,000 | $160,480 |
| 2020 | $4,519 | $190,960 | $30,000 | $160,960 |
| 2019 | $4,558 | $190,960 | $30,000 | $160,960 |
| 2018 | $4,758 | $234,040 | $64,000 | $170,040 |
| 2017 | $4,556 | $190,506 | $26,496 | $164,010 |
| 2016 | $4,687 | $195,993 | $26,496 | $169,497 |
| 2015 | $4,838 | $195,993 | $26,496 | $169,497 |
| 2014 | $4,470 | $175,386 | $26,496 | $148,890 |
| 2013 | -- | $162,256 | $24,480 | $137,776 |
Source: Public Records
Map
Nearby Homes
- 1070 Dogwood Way
- 194 Waterfront Park Ln
- 233 Holly Dr
- 35 E Harbor Dr
- Manchester Plan at East Harbor II at Chestatee
- Leyland Plan at East Harbor II at Chestatee
- Scarlet Plan at East Harbor II at Chestatee
- 25 River Sound Cir
- 648 Dogwood Way
- 803 Night Fire Dr
- 1619 Price Rd
- 5766 Ridgewater Cir
- 771 Night Fire Dr
- 239 E Harbor Dr
- 37 Ridgetop Ct
- 194 E Harbor Dr
- 230 E Harbor Dr
- 206 E Harbor Dr
- 5775 Ridgewater Cir
- 0 Holly Dr Unit LOT 44 7095642
- 0 Holly Dr Unit LOT 45 7095644
- 0 Holly Dr Unit LOT 44
- 0 Holly Dr Unit 7560651
- 0 Holly Dr Unit 8945937
- 0 Holly Dr Unit 8769725
- 0 Holly Dr Unit 3067647
- 0 Holly Dr Unit 7022634
- 0 Holly Dr Unit 7581956
- 48 Holly Dr
- 1114 Dogwood Way
- 60 Holly Dr
- 45 Holly Dr
- 66 Holly Dr
- 1101 Dogwood Way
- 1084 Dogwood Way
- 76 Holly Dr
- 70 Waterfront Park Ct Unit 65
- 70 Waterfront Park Ct
- 1117 Dogwood Way