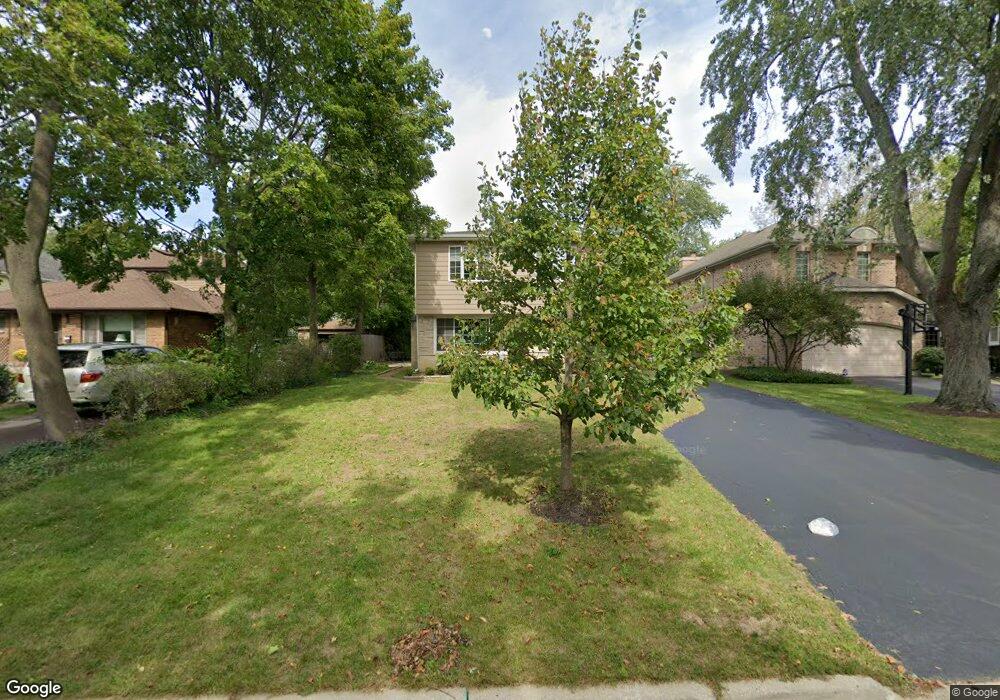
1150 Linden Ave Deerfield, IL 60015
Woodland NeighborhoodEstimated Value: $648,912 - $753,000
3
Beds
2
Baths
2,025
Sq Ft
$345/Sq Ft
Est. Value
About This Home
This home is located at 1150 Linden Ave, Deerfield, IL 60015 and is currently estimated at $697,728, approximately $344 per square foot. 1150 Linden Ave is a home located in Lake County with nearby schools including Walden Elementary School, Alan B Shepard Middle School, and Deerfield High School.
Ownership History
Date
Name
Owned For
Owner Type
Purchase Details
Closed on
Aug 8, 2001
Sold by
Oliff Martin and Oliff Joellyn
Bought by
Solomon Gary S and Solomon Deborah L
Current Estimated Value
Home Financials for this Owner
Home Financials are based on the most recent Mortgage that was taken out on this home.
Original Mortgage
$269,600
Outstanding Balance
$100,217
Interest Rate
6.5%
Estimated Equity
$597,511
Purchase Details
Closed on
Jul 31, 1998
Sold by
Fontana Anthony G and Fontana Angela K
Bought by
Oliff Martin and Oliff Joellyn
Home Financials for this Owner
Home Financials are based on the most recent Mortgage that was taken out on this home.
Original Mortgage
$224,000
Interest Rate
7.05%
Purchase Details
Closed on
Jun 15, 1995
Sold by
Fontana Anthony G
Bought by
Fontana Anthony G and Fontana Angela K
Home Financials for this Owner
Home Financials are based on the most recent Mortgage that was taken out on this home.
Original Mortgage
$179,000
Interest Rate
7.9%
Create a Home Valuation Report for This Property
The Home Valuation Report is an in-depth analysis detailing your home's value as well as a comparison with similar homes in the area
Home Values in the Area
Average Home Value in this Area
Purchase History
| Date | Buyer | Sale Price | Title Company |
|---|---|---|---|
| Solomon Gary S | $337,000 | Centennial Title Incorporate | |
| Oliff Martin | $280,000 | -- | |
| Fontana Anthony G | -- | Chicago Title Insurance Co |
Source: Public Records
Mortgage History
| Date | Status | Borrower | Loan Amount |
|---|---|---|---|
| Open | Solomon Gary S | $269,600 | |
| Previous Owner | Oliff Martin | $224,000 | |
| Previous Owner | Fontana Anthony G | $179,000 |
Source: Public Records
Tax History Compared to Growth
Tax History
| Year | Tax Paid | Tax Assessment Tax Assessment Total Assessment is a certain percentage of the fair market value that is determined by local assessors to be the total taxable value of land and additions on the property. | Land | Improvement |
|---|---|---|---|---|
| 2024 | $14,707 | $171,155 | $41,008 | $130,147 |
| 2023 | $14,429 | $164,256 | $39,355 | $124,901 |
| 2022 | $14,429 | $158,278 | $42,270 | $116,008 |
| 2021 | $13,609 | $152,601 | $40,754 | $111,847 |
| 2020 | $13,089 | $152,922 | $40,840 | $112,082 |
| 2019 | $12,790 | $152,663 | $40,771 | $111,892 |
| 2018 | $12,086 | $150,392 | $43,214 | $107,178 |
| 2017 | $11,989 | $149,912 | $43,076 | $106,836 |
| 2016 | $11,655 | $144,243 | $41,447 | $102,796 |
| 2015 | $11,410 | $135,529 | $38,943 | $96,586 |
| 2014 | $11,514 | $134,857 | $39,222 | $95,635 |
| 2012 | $11,237 | $133,667 | $38,876 | $94,791 |
Source: Public Records
Map
Nearby Homes
- 1131 Linden Ave
- 1444 Crowe Ave
- 1265 Woodland Dr
- 1410 Berkley Ct
- 1342 Barclay Ln Unit 36
- 1045 Fairoaks Ave
- 1504 Northwoods Rd
- 1041 Sheridan Ave
- 1423 Northwoods Rd
- 1770 Overland Trail
- 1620 Berkeley Ct
- 926 Cedar St
- 904 Forest Ave
- 1119 Hampton Ct Unit 1
- 602 Warwick Rd
- 828 Chestnut St
- 1015 Deerfield Rd Unit 135
- 816 Appletree Ln
- 1380 Valley Rd
- 1630 Ridge Rd
- 1144 Linden Ave
- 1156 Linden Ave
- 1160 Linden Ave
- 1138 Linden Ave
- 1149 Camille Ave
- 1155 Camille Ave
- 1143 Camille Ave
- 1161 Camille Ave
- 1137 Camille Ave
- 1132 Linden Ave
- 1151 Linden Ave
- 1157 Linden Ave
- 1139 Linden Ave
- 1131 Camille Ave
- 1204 Linden Ave
- 1411 Stratford Rd
- 1165 Linden Ave
- 1126 Linden Ave
- 1419 Stratford Rd
- 1120 Linden Ave