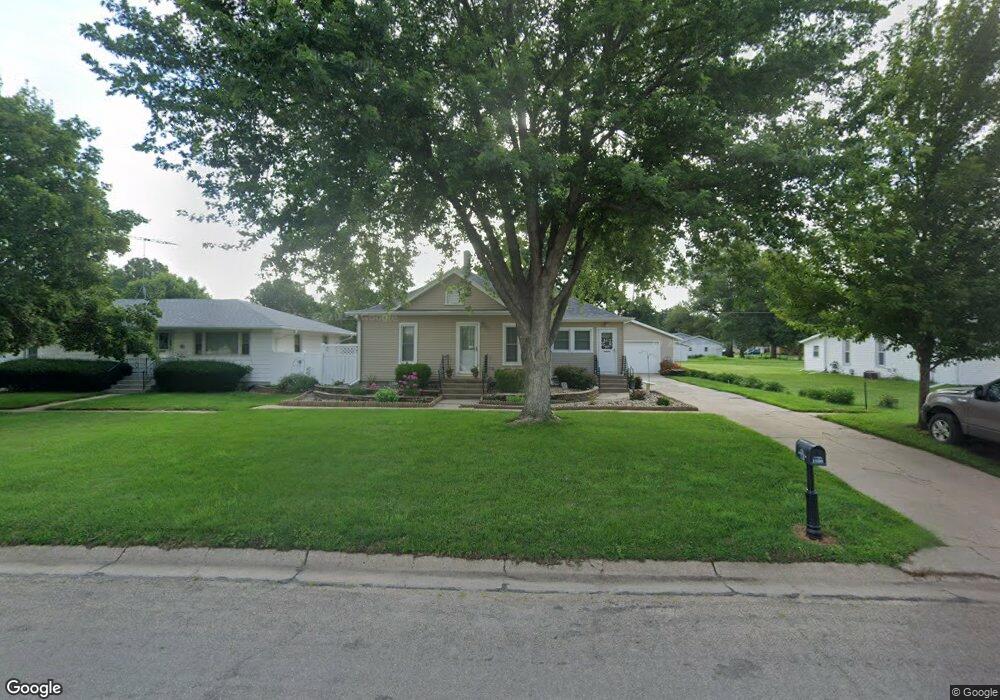
1150 N 7th St David City, NE 68632
Estimated Value: $139,000 - $185,000
2
Beds
2
Baths
1,224
Sq Ft
$140/Sq Ft
Est. Value
About This Home
This home is located at 1150 N 7th St, David City, NE 68632 and is currently estimated at $170,816, approximately $139 per square foot. 1150 N 7th St is a home located in Butler County with nearby schools including David City Secondary School, St. Mary's School, and Aquinas High School.
Ownership History
Date
Name
Owned For
Owner Type
Purchase Details
Closed on
Dec 18, 2024
Sold by
Jansen Richard J and Jansen Laurie L
Bought by
Maca Setphanie and Vanis Ashley
Current Estimated Value
Purchase Details
Closed on
Sep 30, 2011
Sold by
Nebraska Energy Federal Credit Union
Bought by
Jansen Richard J and Jansen Laurie
Home Financials for this Owner
Home Financials are based on the most recent Mortgage that was taken out on this home.
Original Mortgage
$41,600
Interest Rate
4.28%
Create a Home Valuation Report for This Property
The Home Valuation Report is an in-depth analysis detailing your home's value as well as a comparison with similar homes in the area
Home Values in the Area
Average Home Value in this Area
Purchase History
| Date | Buyer | Sale Price | Title Company |
|---|---|---|---|
| Maca Setphanie | -- | None Listed On Document | |
| Jansen Richard J | $41,600 | -- |
Source: Public Records
Mortgage History
| Date | Status | Borrower | Loan Amount |
|---|---|---|---|
| Previous Owner | Jansen Richard J | $41,600 |
Source: Public Records
Tax History Compared to Growth
Tax History
| Year | Tax Paid | Tax Assessment Tax Assessment Total Assessment is a certain percentage of the fair market value that is determined by local assessors to be the total taxable value of land and additions on the property. | Land | Improvement |
|---|---|---|---|---|
| 2024 | $1,324 | $110,170 | $15,470 | $94,700 |
| 2023 | $1,512 | $101,185 | $15,470 | $85,715 |
| 2022 | $1,352 | $87,900 | $15,470 | $72,430 |
| 2021 | $1,280 | $83,140 | $9,100 | $74,040 |
| 2020 | $1,276 | $81,430 | $9,100 | $72,330 |
| 2019 | $1,145 | $73,315 | $9,100 | $64,215 |
| 2018 | $1,005 | $65,405 | $9,100 | $56,305 |
| 2017 | $1,012 | $65,945 | $9,100 | $56,845 |
| 2016 | $953 | $63,230 | $9,100 | $54,130 |
| 2015 | $1,004 | $62,365 | $9,100 | $53,265 |
| 2014 | $974 | $58,405 | $9,100 | $49,305 |
Source: Public Records
Map
Nearby Homes