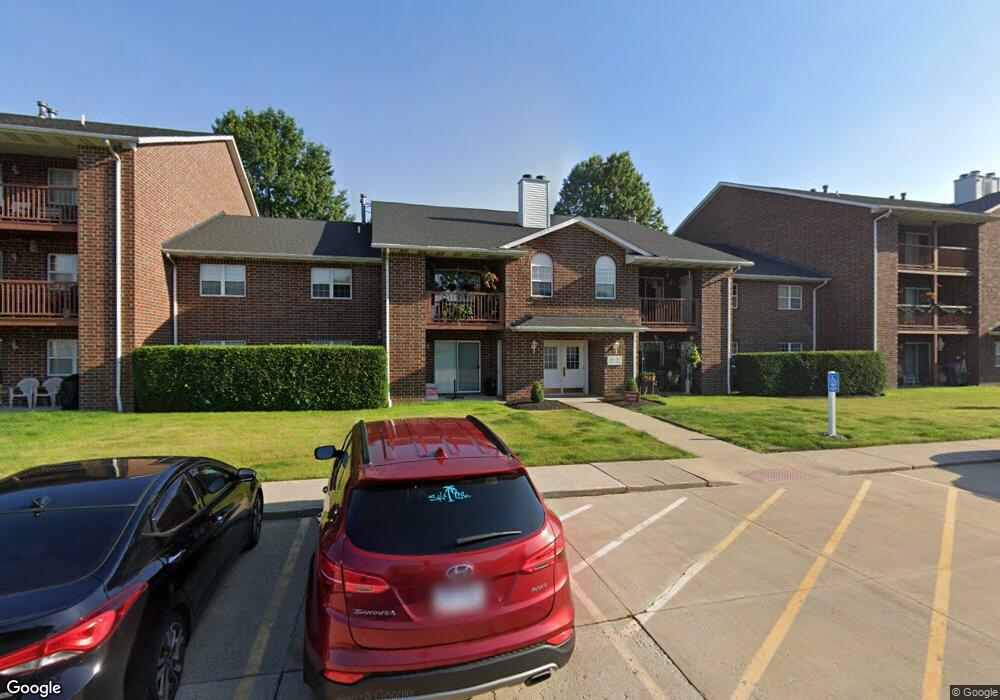
1150 Tollis Pkwy Unit 219 Broadview Heights, OH 44147
Estimated Value: $145,000 - $175,000
2
Beds
1
Bath
1,149
Sq Ft
$134/Sq Ft
Est. Value
About This Home
This home is located at 1150 Tollis Pkwy Unit 219, Broadview Heights, OH 44147 and is currently estimated at $154,214, approximately $134 per square foot. 1150 Tollis Pkwy Unit 219 is a home located in Cuyahoga County with nearby schools including Brecksville-Broadview Heights Middle School, Brecksville-Broadview Heights High School, and Assumption Academy.
Ownership History
Date
Name
Owned For
Owner Type
Purchase Details
Closed on
Mar 14, 2006
Sold by
Mehalik Stephen W
Bought by
Skuza Susan Magistro
Current Estimated Value
Home Financials for this Owner
Home Financials are based on the most recent Mortgage that was taken out on this home.
Original Mortgage
$103,200
Outstanding Balance
$57,286
Interest Rate
5.87%
Mortgage Type
Purchase Money Mortgage
Estimated Equity
$96,928
Purchase Details
Closed on
Feb 7, 2001
Sold by
Mccarty Cynthia Ann and Will Of Zane R Tollis
Bought by
Mehalik Stephen W
Home Financials for this Owner
Home Financials are based on the most recent Mortgage that was taken out on this home.
Original Mortgage
$71,900
Interest Rate
7.06%
Create a Home Valuation Report for This Property
The Home Valuation Report is an in-depth analysis detailing your home's value as well as a comparison with similar homes in the area
Home Values in the Area
Average Home Value in this Area
Purchase History
| Date | Buyer | Sale Price | Title Company |
|---|---|---|---|
| Skuza Susan Magistro | $100,000 | Midland Title Security Inc | |
| Mehalik Stephen W | $89,900 | Chicago Title Insurance Comp |
Source: Public Records
Mortgage History
| Date | Status | Borrower | Loan Amount |
|---|---|---|---|
| Open | Skuza Susan Magistro | $103,200 | |
| Previous Owner | Mehalik Stephen W | $71,900 |
Source: Public Records
Tax History Compared to Growth
Tax History
| Year | Tax Paid | Tax Assessment Tax Assessment Total Assessment is a certain percentage of the fair market value that is determined by local assessors to be the total taxable value of land and additions on the property. | Land | Improvement |
|---|---|---|---|---|
| 2024 | $2,530 | $41,090 | $4,095 | $36,995 |
| 2023 | $2,270 | $34,200 | $3,400 | $30,800 |
| 2022 | $2,256 | $34,200 | $3,400 | $30,800 |
| 2021 | $2,290 | $34,200 | $3,400 | $30,800 |
| 2020 | $1,996 | $28,490 | $2,840 | $25,660 |
| 2019 | $1,940 | $81,400 | $8,100 | $73,300 |
| 2018 | $1,911 | $28,490 | $2,840 | $25,660 |
| 2017 | $1,956 | $27,590 | $2,770 | $24,820 |
| 2016 | $1,863 | $27,590 | $2,770 | $24,820 |
| 2015 | $1,862 | $27,590 | $2,770 | $24,820 |
| 2014 | $2,212 | $33,220 | $3,330 | $29,890 |
Source: Public Records
Map
Nearby Homes
- 8677 Scenicview Dr
- 8586 Northwood Dr
- 11960 Apollo Dr
- 8595 Scenicview Dr Unit S104
- 3204 Thorn Tree Dr
- 550 Tollis Pkwy Unit 307
- 511 Tollis Pkwy
- 0 Village Dr
- 11431 Villa Grande Dr
- 9055 Ledge View Terrace
- 9075 Ledge View Terrace
- 9135 Vista Dr
- LUCAS TH Plan at The Ledges
- 9210 Ledge View Terrace
- LIBBY TH Plan at The Ledges
- ABBY TH Plan at The Ledges
- 2801 W Royalton Rd
- 2301 W Royalton Rd
- 4450 Sir Robert Ave
- 9741 Royal Valley Dr
- 1150 Tollis Pkwy Unit 209
- 1150 Tollis Pkwy Unit 120
- 1150 Tollis Pkwy Unit 224
- 1150 Tollis Pkwy Unit 225
- 1150 Tollis Pkwy Unit 323
- 1150 Tollis Pkwy Unit 321
- 1150 Tollis Pkwy Unit 322
- 1150 Tollis Pkwy Unit 212
- 1150 Tollis Pkwy Unit 122
- 1150 Tollis Pkwy Unit 216
- 1150 Tollis Pkwy Unit 110
- 1150 Tollis Pkwy Unit 220
- 1150 Tollis Pkwy Unit 211
- 1150 Tollis Pkwy Unit 109
- 1150 Tollis Pkwy Unit 112
- 1150 Tollis Pkwy Unit 222
- 1150 Tollis Pkwy Unit 111
- 1150 Tollis Pkwy Unit 210
- 1150 Tollis Pkwy Unit 124
- 1150 Tollis Pkwy Unit 118