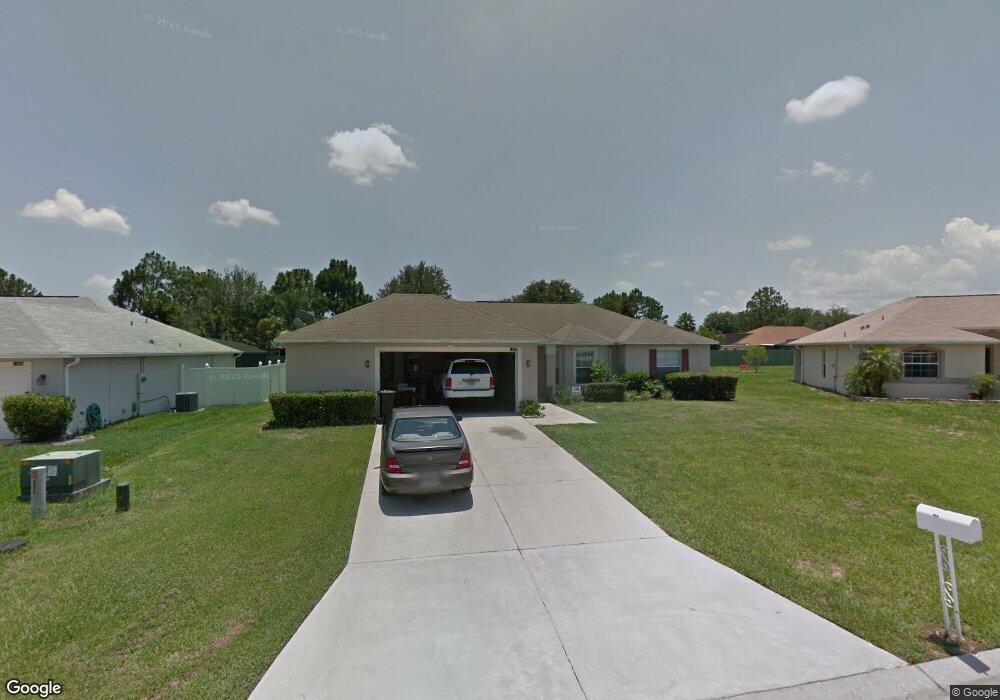
11503 Patrico Loop Clermont, FL 34711
Estimated Value: $334,000 - $383,000
3
Beds
2
Baths
1,572
Sq Ft
$229/Sq Ft
Est. Value
About This Home
This home is located at 11503 Patrico Loop, Clermont, FL 34711 and is currently estimated at $359,804, approximately $228 per square foot. 11503 Patrico Loop is a home located in Lake County with nearby schools including Pine Ridge Elementary School, Gray Middle School, and South Lake High School.
Ownership History
Date
Name
Owned For
Owner Type
Purchase Details
Closed on
Mar 2, 2007
Sold by
Asfeld David L
Bought by
Persaud Radika
Current Estimated Value
Home Financials for this Owner
Home Financials are based on the most recent Mortgage that was taken out on this home.
Original Mortgage
$260,000
Outstanding Balance
$185,935
Interest Rate
10.1%
Mortgage Type
Purchase Money Mortgage
Estimated Equity
$173,869
Purchase Details
Closed on
Feb 10, 2005
Sold by
Highland Homes Of Clermont Inc
Bought by
Asfeld David L
Home Financials for this Owner
Home Financials are based on the most recent Mortgage that was taken out on this home.
Original Mortgage
$45,800
Interest Rate
5.54%
Mortgage Type
Purchase Money Mortgage
Purchase Details
Closed on
Jul 8, 2004
Sold by
Ladd Development Inc
Bought by
Highland Homes Of Clermont Inc
Create a Home Valuation Report for This Property
The Home Valuation Report is an in-depth analysis detailing your home's value as well as a comparison with similar homes in the area
Purchase History
| Date | Buyer | Sale Price | Title Company |
|---|---|---|---|
| Persaud Radika | $260,000 | Tropical Real Estate Title S | |
| Asfeld David L | $160,300 | South Lake Title Svcs Inc | |
| Highland Homes Of Clermont Inc | $70,000 | South Lake Title Svcs Inc |
Source: Public Records
Mortgage History
| Date | Status | Borrower | Loan Amount |
|---|---|---|---|
| Open | Persaud Radika | $260,000 | |
| Previous Owner | Asfeld David L | $45,800 |
Source: Public Records
Tax History
| Year | Tax Paid | Tax Assessment Tax Assessment Total Assessment is a certain percentage of the fair market value that is determined by local assessors to be the total taxable value of land and additions on the property. | Land | Improvement |
|---|---|---|---|---|
| 2026 | $4,316 | $278,121 | $74,400 | $203,721 |
| 2025 | $3,958 | $278,461 | $74,400 | $204,061 |
| 2024 | $3,958 | $278,461 | $74,400 | $204,061 |
| 2023 | $3,958 | $273,642 | $74,400 | $199,242 |
| 2022 | $3,405 | $231,451 | $32,550 | $198,901 |
| 2021 | $3,124 | $197,401 | $0 | $0 |
| 2020 | $3,157 | $197,674 | $0 | $0 |
| 2019 | $3,162 | $187,097 | $0 | $0 |
| 2018 | $3,103 | $187,249 | $0 | $0 |
| 2017 | $2,914 | $175,759 | $0 | $0 |
| 2016 | $2,978 | $176,008 | $0 | $0 |
| 2015 | $2,870 | $162,621 | $0 | $0 |
| 2014 | $2,893 | $162,208 | $0 | $0 |
Source: Public Records
Map
Nearby Homes
- 0 Oswalt Rd
- 11437 Wishing Well Ln
- 10250 Dovehill Ln
- 11430 Wishing Well Ln
- 10017 Weathers Loop
- 11644 Pineloch Loop
- 10016 Weathers Loop
- 10446 Jardim de Largo St
- 11242 Scenic Vista Dr
- 9704 Royal Vista Ave
- 10148 Florence Ridge Dr
- 11126 Scenic Vista Dr
- 11110 Oleander Dr
- 10010 Lakeshore Dr
- 10220 Yonaomi Cir
- 11202 Nellie Crossing Cir
- 10431 Reagans Run Dr
- 11759 Oswalt Rd
- 11070 Nellie Crossing Cir
- 10611 Reagans Run Dr
- 11453 Patrico Loop
- 11507 Patrico Loop
- 11539 Autumn Wind Loop
- 11533 Autumn Wind Loop
- 11449 Patrico Loop
- 11545 Autumn Wind Loop
- 11502 Patrico Loop
- 11511 Patrico Loop
- 11527 Autumn Wind Loop
- 11551 Autumn Wind Loop
- 11438 Patrico Loop
- 11515 Patrico Loop
- 11518 Patrico Loop
- 11445 Patrico Loop
- 11434 Patrico Loop
- 11521 Autumn Wind Loop
- 11519 Patrico Loop
- 11542 Autumn Wind Loop
- 11522 Patrico Loop
- 11536 Autumn Wind Loop
Your Personal Tour Guide
Ask me questions while you tour the home.