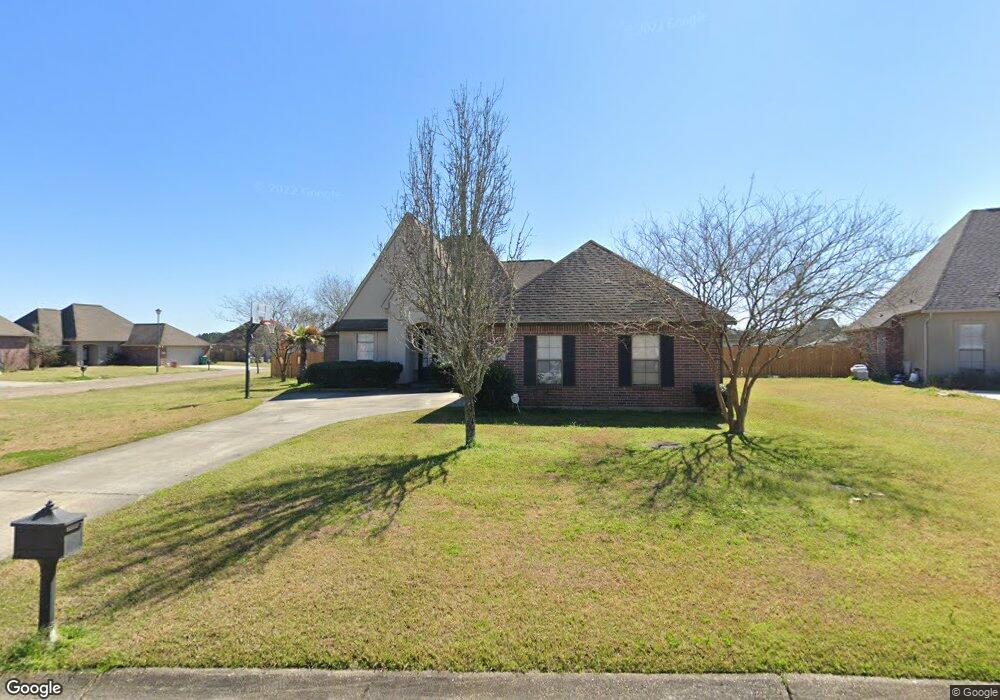
11504 Lemonwood Dr Denham Springs, LA 70726
Estimated Value: $296,000 - $319,083
4
Beds
3
Baths
2,613
Sq Ft
$119/Sq Ft
Est. Value
About This Home
This home is located at 11504 Lemonwood Dr, Denham Springs, LA 70726 and is currently estimated at $310,771, approximately $118 per square foot. 11504 Lemonwood Dr is a home located in Livingston Parish with nearby schools including Juban Parc Elementary School, Juban Parc Junior High School, and Denham Springs Freshman High School.
Ownership History
Date
Name
Owned For
Owner Type
Purchase Details
Closed on
Jan 16, 2009
Sold by
Fitzgerald Fallis John M and Fitzgerald Fallis Kelly
Bought by
Karisny David Florian and Karisny Dana Nastasi
Current Estimated Value
Home Financials for this Owner
Home Financials are based on the most recent Mortgage that was taken out on this home.
Original Mortgage
$200,000
Interest Rate
5.09%
Mortgage Type
New Conventional
Purchase Details
Closed on
Feb 21, 2008
Sold by
Rogers Timothy R and Rogers Melissa Ann
Bought by
Fitzgerald Fallis John M and Fitzgerald Fallis Kelly
Purchase Details
Closed on
Jun 24, 2005
Sold by
Pcc Home Builders Inc
Bought by
Rogers Timothy R and Rogers Millissa Ann
Home Financials for this Owner
Home Financials are based on the most recent Mortgage that was taken out on this home.
Original Mortgage
$189,900
Interest Rate
5.63%
Mortgage Type
New Conventional
Create a Home Valuation Report for This Property
The Home Valuation Report is an in-depth analysis detailing your home's value as well as a comparison with similar homes in the area
Home Values in the Area
Average Home Value in this Area
Purchase History
| Date | Buyer | Sale Price | Title Company |
|---|---|---|---|
| Karisny David Florian | $235,000 | Gulf Coast Title Inc | |
| Fitzgerald Fallis John M | $240,000 | Commerce Title Sherwood | |
| Rogers Timothy R | $199,900 | Provident Title Company Inc |
Source: Public Records
Mortgage History
| Date | Status | Borrower | Loan Amount |
|---|---|---|---|
| Closed | Karisny David Florian | $200,000 | |
| Previous Owner | Rogers Timothy R | $189,900 |
Source: Public Records
Tax History Compared to Growth
Tax History
| Year | Tax Paid | Tax Assessment Tax Assessment Total Assessment is a certain percentage of the fair market value that is determined by local assessors to be the total taxable value of land and additions on the property. | Land | Improvement |
|---|---|---|---|---|
| 2024 | $3,040 | $29,093 | $2,430 | $26,663 |
| 2023 | $2,601 | $21,480 | $2,430 | $19,050 |
| 2022 | $2,619 | $21,480 | $2,430 | $19,050 |
| 2021 | $2,305 | $21,480 | $2,430 | $19,050 |
| 2020 | $2,293 | $21,480 | $2,430 | $19,050 |
| 2019 | $2,082 | $18,950 | $2,430 | $16,520 |
| 2018 | $2,101 | $18,950 | $2,430 | $16,520 |
| 2017 | $2,055 | $18,120 | $2,430 | $15,690 |
| 2015 | $1,813 | $23,080 | $2,430 | $20,650 |
| 2014 | $1,843 | $23,080 | $2,430 | $20,650 |
Source: Public Records
Map
Nearby Homes
- 26153 Willette Ave
- 26152 Willette Ave
- 26141 Willette Ave
- 26159 Willette Ave
- 11407 Lemonwood Dr
- 11411 Pleasant Knoll Dr
- 11414 Pleasant Knoll Dr
- 11372 Densmore Dr
- 11336 Meadow View Dr
- 11372 Pleasant Knoll Dr
- Abbey IV H Plan at Ellis Estates
- Abbey IV G Plan at Ellis Estates
- Leonardo IV G Plan at Ellis Estates
- Birkenhead III H Plan at Ellis Estates
- Birkenhead III G Plan at Ellis Estates
- Massimo II H Plan at Ellis Estates
- Domenico III B Plan at Ellis Estates
- Domenico III A Plan at Ellis Estates
- Alfani III H Plan at Ellis Estates
- Alfani III G Plan at Ellis Estates
- 11494 Lemonwood Dr
- 11531 Pleasant Knoll Dr
- 11491 Meadow View Dr
- 11486 Lemonwood Dr
- 11485 Meadow View Dr
- 11468 Meadow View Dr
- 11497 Meadow View Dr
- 11515 Pleasant Knoll Dr
- 11477 Meadow View Dr
- 11548 Pleasant Knoll Dr
- 11540 Pleasant Knoll Dr
- 11478 Lemonwood Dr
- 11469 Meadow View Dr
- 11507 Pleasant Knoll Dr
- 11458 Meadow View Dr
- 11458 Meadowview Dr
- 11483 Lemonwood Dr
- 11532 Pleasant Knoll Dr
- 11461 Meadow View Dr
- 11470 Lemonwood Dr