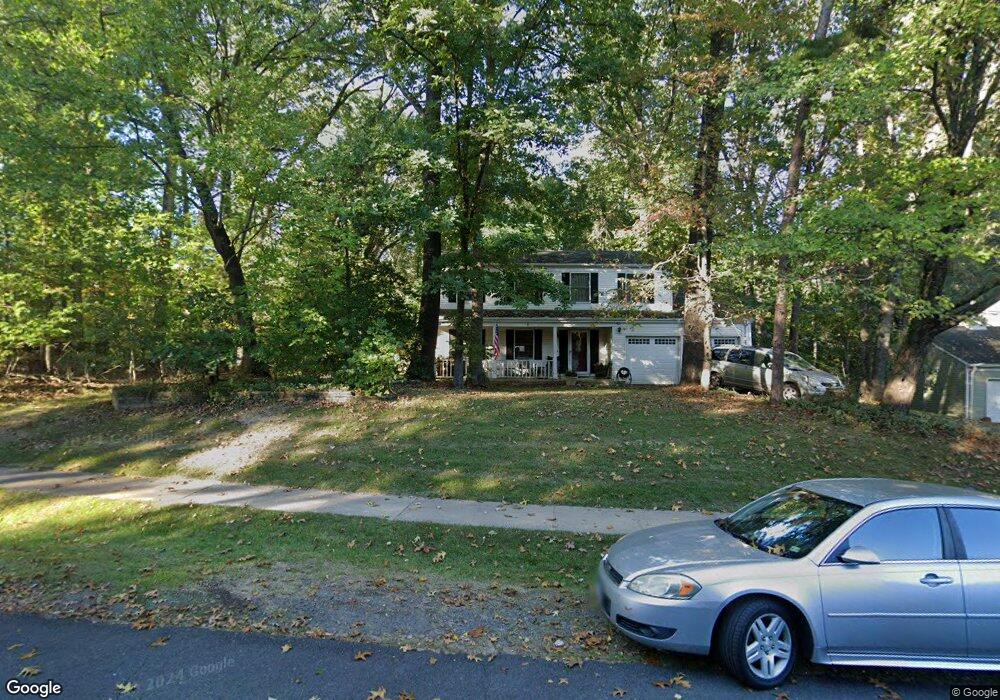
11506 Running Cedar Rd Reston, VA 20191
Estimated Value: $794,000 - $877,000
4
Beds
3
Baths
2,004
Sq Ft
$414/Sq Ft
Est. Value
About This Home
This home is located at 11506 Running Cedar Rd, Reston, VA 20191 and is currently estimated at $829,287, approximately $413 per square foot. 11506 Running Cedar Rd is a home located in Fairfax County with nearby schools including Hunters Woods Elementary, Langston Hughes Middle School, and South Lakes High School.
Ownership History
Date
Name
Owned For
Owner Type
Purchase Details
Closed on
Mar 28, 2005
Sold by
James C Davis Trustee
Bought by
Mooney Justin C and Gannon,Fiona M
Current Estimated Value
Home Financials for this Owner
Home Financials are based on the most recent Mortgage that was taken out on this home.
Original Mortgage
$480,000
Outstanding Balance
$244,153
Interest Rate
5.56%
Mortgage Type
New Conventional
Estimated Equity
$585,134
Purchase Details
Closed on
Jun 29, 1998
Sold by
Losi Peter C
Bought by
Davis James C
Home Financials for this Owner
Home Financials are based on the most recent Mortgage that was taken out on this home.
Original Mortgage
$100,000
Interest Rate
7.09%
Purchase Details
Closed on
Jul 18, 1994
Sold by
Kennedy Alice
Bought by
Losi Peter C
Home Financials for this Owner
Home Financials are based on the most recent Mortgage that was taken out on this home.
Original Mortgage
$199,500
Interest Rate
8.51%
Create a Home Valuation Report for This Property
The Home Valuation Report is an in-depth analysis detailing your home's value as well as a comparison with similar homes in the area
Home Values in the Area
Average Home Value in this Area
Purchase History
| Date | Buyer | Sale Price | Title Company |
|---|---|---|---|
| Mooney Justin C | $600,000 | -- | |
| Davis James C | $257,000 | -- | |
| Losi Peter C | $210,000 | -- |
Source: Public Records
Mortgage History
| Date | Status | Borrower | Loan Amount |
|---|---|---|---|
| Open | Mooney Justin C | $480,000 | |
| Previous Owner | Losi Peter C | $100,000 | |
| Previous Owner | Losi Peter C | $199,500 |
Source: Public Records
Tax History
| Year | Tax Paid | Tax Assessment Tax Assessment Total Assessment is a certain percentage of the fair market value that is determined by local assessors to be the total taxable value of land and additions on the property. | Land | Improvement |
|---|---|---|---|---|
| 2025 | $8,511 | $753,750 | $322,000 | $431,750 |
| 2024 | $8,511 | $706,020 | $302,000 | $404,020 |
| 2023 | $8,018 | $682,070 | $302,000 | $380,070 |
| 2022 | $7,672 | $644,460 | $272,000 | $372,460 |
| 2021 | $7,501 | $614,560 | $252,000 | $362,560 |
| 2020 | $7,300 | $593,290 | $237,000 | $356,290 |
| 2019 | $6,995 | $568,500 | $227,000 | $341,500 |
| 2018 | $6,365 | $553,500 | $212,000 | $341,500 |
| 2017 | $6,686 | $553,500 | $212,000 | $341,500 |
| 2016 | $6,471 | $536,800 | $202,000 | $334,800 |
Source: Public Records
Map
Nearby Homes
- 2502 Woodcutter Ct
- 11612 Clipstone Ln
- 2584 Vintage Crest Ln
- 11214 Stuart Mill Rd
- 11203 Leatherwood Dr
- 2261 Cedar Cove Ct
- 2345 Millennium Ln
- 11609 Stoneview Square Unit 11C
- 11713 Stillbrook Ct
- 2346 Millennium Ln
- 11637 Stoneview Square Unit 2B
- 11728 Stuart Mill Rd
- 2698 Linda Marie Dr
- 11000 Oakton Woods Way
- 11312 Timberline Dr
- 2255 Castle Rock Square Unit 21C
- 2615 Steeplechase Dr
- 2216 Castle Rock Square Unit 12C
- 2233 Lovedale Ln Unit L
- 2233 Lovedale Ln Unit I
- 11502 Running Cedar Rd
- 11510 Running Cedar Rd
- 11500 Running Cedar Rd
- 2501 Wood Fern Ct
- 2428 Bramblebush Ct
- 11503 Running Cedar Rd
- 11507 Running Cedar Rd
- 11509 Running Cedar Rd
- 2500 Wood Fern Ct
- 2430 Bramblebush Ct
- 2501 Foxcroft Way
- 2426 Bramblebush Ct
- 11511 Running Cedar Rd
- 2424 Bramblebush Ct
- 2504 Wood Fern Ct
- 2502 Wood Fern Ct
- 11513 Running Cedar Rd
- 2502 Foxcroft Way
- 2503 Foxcroft Way
- 2422 Bramblebush Ct
Your Personal Tour Guide
Ask me questions while you tour the home.