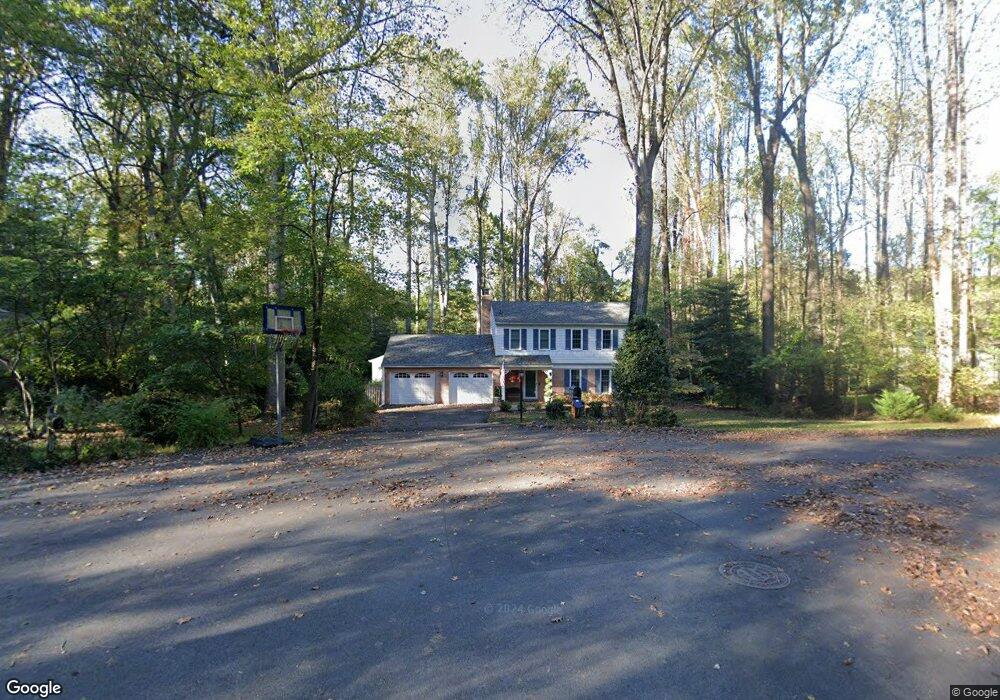
11508 Drop Forge Ln Reston, VA 20191
Estimated Value: $1,009,000 - $1,027,000
5
Beds
4
Baths
3,192
Sq Ft
$319/Sq Ft
Est. Value
About This Home
This home is located at 11508 Drop Forge Ln, Reston, VA 20191 and is currently estimated at $1,018,059, approximately $318 per square foot. 11508 Drop Forge Ln is a home located in Fairfax County with nearby schools including Hunters Woods Elementary, Langston Hughes Middle School, and South Lakes High School.
Ownership History
Date
Name
Owned For
Owner Type
Purchase Details
Closed on
Dec 4, 2022
Sold by
Houseman Karen A
Bought by
Karen Anne Houseman Revocable Living Trust
Current Estimated Value
Purchase Details
Closed on
Jul 1, 2010
Sold by
Vanhaaren Todd M
Bought by
Vanhaaren Karen A
Home Financials for this Owner
Home Financials are based on the most recent Mortgage that was taken out on this home.
Original Mortgage
$272,544
Interest Rate
4.78%
Mortgage Type
New Conventional
Purchase Details
Closed on
Mar 1, 1999
Sold by
Greer Bobby J
Bought by
Vanhaaren Todd M
Home Financials for this Owner
Home Financials are based on the most recent Mortgage that was taken out on this home.
Original Mortgage
$185,000
Interest Rate
6.78%
Create a Home Valuation Report for This Property
The Home Valuation Report is an in-depth analysis detailing your home's value as well as a comparison with similar homes in the area
Home Values in the Area
Average Home Value in this Area
Purchase History
| Date | Buyer | Sale Price | Title Company |
|---|---|---|---|
| Karen Anne Houseman Revocable Living Trust | -- | -- | |
| Vanhaaren Karen A | -- | -- | |
| Vanhaaren Todd M | $257,500 | -- |
Source: Public Records
Mortgage History
| Date | Status | Borrower | Loan Amount |
|---|---|---|---|
| Previous Owner | Vanhaaren Karen A | $272,544 | |
| Previous Owner | Vanhaaren Todd M | $185,000 |
Source: Public Records
Tax History
| Year | Tax Paid | Tax Assessment Tax Assessment Total Assessment is a certain percentage of the fair market value that is determined by local assessors to be the total taxable value of land and additions on the property. | Land | Improvement |
|---|---|---|---|---|
| 2025 | $10,027 | $894,720 | $330,000 | $564,720 |
| 2024 | $10,027 | $831,760 | $310,000 | $521,760 |
| 2023 | $9,311 | $792,060 | $310,000 | $482,060 |
| 2022 | $8,673 | $758,470 | $280,000 | $478,470 |
| 2021 | $8,858 | $725,760 | $260,000 | $465,760 |
| 2020 | $9,346 | $702,690 | $245,000 | $457,690 |
| 2019 | $8,393 | $682,050 | $235,000 | $447,050 |
| 2018 | $7,683 | $668,050 | $221,000 | $447,050 |
| 2017 | $8,070 | $668,050 | $221,000 | $447,050 |
| 2016 | $7,815 | $648,280 | $210,000 | $438,280 |
Source: Public Records
Map
Nearby Homes
- 2502 Woodcutter Ct
- 11612 Clipstone Ln
- 2584 Vintage Crest Ln
- 11214 Stuart Mill Rd
- 2345 Millennium Ln
- 11609 Stoneview Square Unit 11C
- 11713 Stillbrook Ct
- 2346 Millennium Ln
- 11637 Stoneview Square Unit 2B
- 11203 Leatherwood Dr
- 2261 Cedar Cove Ct
- 2255 Castle Rock Square Unit 21C
- 2216 Castle Rock Square Unit 12C
- 2233 Lovedale Ln Unit L
- 2233 Lovedale Ln Unit I
- 2225 Lovedale Ln Unit 303E
- 11566 Rolling Green Ct Unit 12/200A
- 2315 Glade Bank Way
- 11701 Karbon Hill Ct Unit 508A UNIT C
- 2224 Springwood Dr Unit J
- 11510 Drop Forge Ln
- 11506 Drop Forge Ln
- 2500 Pinoak Ln
- 11511 Drop Forge Ln
- 2502 Pinoak Ln
- 11507 Drop Forge Ln
- 11505 Drop Forge Ln
- 11504 Drop Forge Ln
- 11509 Drop Forge Ln
- 2501 Pinoak Ln
- 2504 Pinoak Ln
- 11502 Drop Forge Ln
- 2503 Pinoak Ln
- 2506 Pinoak Ln
- 11503 Drop Forge Ln
- 2505 Pinoak Ln
- 11511 Catalpa Ct
- 11500 Drop Forge Ln
- 11520 Running Cedar Rd
- 11600 Virgate Ln
Your Personal Tour Guide
Ask me questions while you tour the home.