Estimated Value: $366,000 - $817,369
4
Beds
2
Baths
2,290
Sq Ft
$253/Sq Ft
Est. Value
About This Home
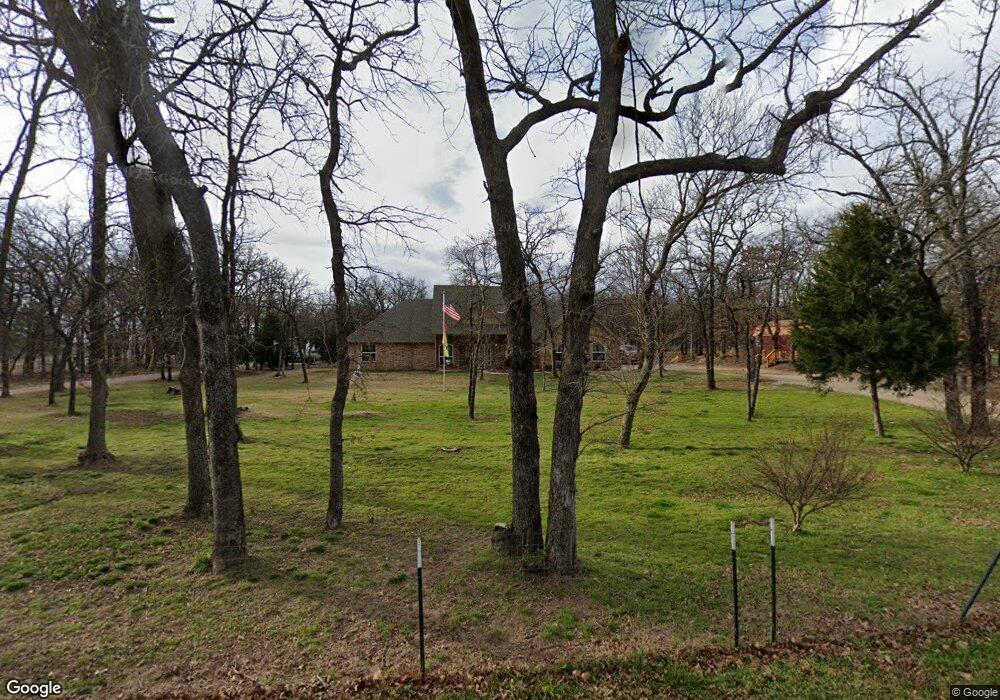
This home is located at 1151 Greg St, Azle, TX 76020 and is currently estimated at $578,842, approximately $252 per square foot. 1151 Greg St is a home located in Parker County with nearby schools including Azle Elementary School, Azle Junior High School, and Azle High School.
Ownership History
Date
Name
Owned For
Owner Type
Purchase Details
Closed on
Sep 1, 2015
Sold by
Collins John Michael and Collins Kimberly Ann
Bought by
Boivin Scott R and Boivin Corrie M
Current Estimated Value
Home Financials for this Owner
Home Financials are based on the most recent Mortgage that was taken out on this home.
Original Mortgage
$289,000
Outstanding Balance
$227,373
Interest Rate
4.12%
Mortgage Type
VA
Estimated Equity
$351,469
Purchase Details
Closed on
Sep 12, 2014
Sold by
Ttt Homes Llc
Bought by
Collins John Michael and Collins Kimberly Ann
Home Financials for this Owner
Home Financials are based on the most recent Mortgage that was taken out on this home.
Original Mortgage
$275,805
Interest Rate
4.15%
Mortgage Type
VA
Purchase Details
Closed on
Jan 30, 2014
Sold by
Ware Mark L & Season
Bought by
Boivin Scott R and Boivin Corrie M
Create a Home Valuation Report for This Property
The Home Valuation Report is an in-depth analysis detailing your home's value as well as a comparison with similar homes in the area
Home Values in the Area
Average Home Value in this Area
Purchase History
| Date | Buyer | Sale Price | Title Company |
|---|---|---|---|
| Boivin Scott R | -- | Capital Title | |
| Collins John Michael | -- | Fidelity National | |
| Boivin Scott R | -- | -- |
Source: Public Records
Mortgage History
| Date | Status | Borrower | Loan Amount |
|---|---|---|---|
| Open | Boivin Scott R | $289,000 | |
| Previous Owner | Collins John Michael | $275,805 |
Source: Public Records
Tax History Compared to Growth
Tax History
| Year | Tax Paid | Tax Assessment Tax Assessment Total Assessment is a certain percentage of the fair market value that is determined by local assessors to be the total taxable value of land and additions on the property. | Land | Improvement |
|---|---|---|---|---|
| 2025 | -- | $691,200 | $240,960 | $450,240 |
| 2024 | -- | $973,750 | $205,730 | $768,020 |
| 2023 | $7,310 | $454,450 | $0 | $0 |
| 2022 | $7,638 | $412,780 | $106,980 | $305,800 |
| 2021 | $8,003 | $412,780 | $106,980 | $305,800 |
| 2020 | $7,720 | $400,340 | $107,100 | $293,240 |
| 2019 | $8,182 | $400,340 | $107,100 | $293,240 |
| 2018 | $5,772 | $281,540 | $47,210 | $234,330 |
| 2017 | $5,500 | $281,540 | $47,210 | $234,330 |
| 2016 | $5,547 | $283,930 | $47,210 | $236,720 |
| 2015 | $1,362 | $283,930 | $47,210 | $236,720 |
| 2014 | $203 | $27,300 | $27,300 | $0 |
Source: Public Records
Map
Nearby Homes
- 13449 S Fm 730
- 237 Gardenia Dr
- 213 Rosemary Dr
- 2001 Forest Bridge Dr
- 501 Red Bud Dr
- 424 Amory St
- 616 Cameron Way
- 438 Lubbock Dr
- 140 Huling Dr
- TBD Ethridge Dr
- 849 Jackson Trail
- 1550 S Stewart St
- 840 Red Oak Ct
- 9999 S Fm 730
- 1008 Rosebud Dr
- 513 Cottage Ct
- 833 Boyd Rd
- 525 Inwood Rd
- 1024 Red Oak St
- 508 Woodland Dr