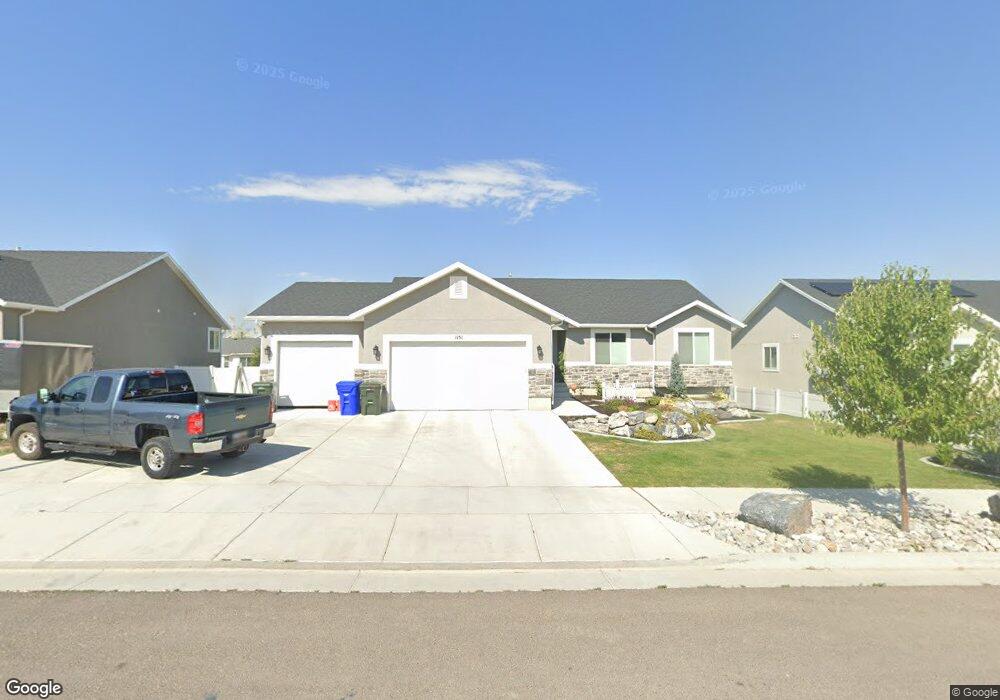
1151 N 640 E Tooele, UT 84074
Estimated Value: $483,000 - $585,000
3
Beds
2
Baths
3,143
Sq Ft
$173/Sq Ft
Est. Value
About This Home
This home is located at 1151 N 640 E, Tooele, UT 84074 and is currently estimated at $543,373, approximately $172 per square foot. 1151 N 640 E is a home located in Tooele County with nearby schools including Middle Canyon Elementary School, Tooele Junior High School, and Tooele High School.
Ownership History
Date
Name
Owned For
Owner Type
Purchase Details
Closed on
Apr 23, 2021
Sold by
Huntsman Leland E and Huntsman Indra Irene
Bought by
Huntsman Leland E and Huntsman Indra Irene
Current Estimated Value
Home Financials for this Owner
Home Financials are based on the most recent Mortgage that was taken out on this home.
Original Mortgage
$356,000
Outstanding Balance
$321,425
Interest Rate
3%
Mortgage Type
New Conventional
Estimated Equity
$221,948
Purchase Details
Closed on
Oct 23, 2020
Sold by
Sunstone Homes Inc
Bought by
Huntsman Leland E and Huntsman Irene
Home Financials for this Owner
Home Financials are based on the most recent Mortgage that was taken out on this home.
Original Mortgage
$316,720
Interest Rate
2.8%
Mortgage Type
New Conventional
Purchase Details
Closed on
Feb 11, 2020
Sold by
Wise Management Llc
Bought by
Sunstone Homes Inc
Create a Home Valuation Report for This Property
The Home Valuation Report is an in-depth analysis detailing your home's value as well as a comparison with similar homes in the area
Purchase History
We collect this data history from publicly available records. To have your information removed, we recommend requesting removal directly through your county’s website.
| Date | Buyer | Sale Price | Title Company |
|---|---|---|---|
| Huntsman Leland E | -- | Inwest Title | |
| Huntsman Leland E | -- | Inwest Title Tooele Office | |
| Huntsman Leland E | -- | Old Republic Title | |
| Sunstone Homes Inc | -- | Security Title Ins Agcy Of |
Source: Public Records
Mortgage History
We collect this data history from publicly available records. To have your information removed, we recommend requesting removal directly through your county’s website.
| Date | Status | Borrower | Loan Amount |
|---|---|---|---|
| Open | Huntsman Leland E | $356,000 | |
| Closed | Huntsman Leland E | $316,720 |
Source: Public Records
Tax History
| Year | Tax Paid | Tax Assessment Tax Assessment Total Assessment is a certain percentage of the fair market value that is determined by local assessors to be the total taxable value of land and additions on the property. | Land | Improvement |
|---|---|---|---|---|
| 2025 | $3,709 | $562,527 | $111,250 | $451,277 |
| 2024 | $4,055 | $309,541 | $61,188 | $248,353 |
| 2023 | $4,055 | $328,952 | $58,262 | $270,690 |
| 2022 | $3,262 | $280,637 | $70,641 | $209,996 |
| 2021 | $3,194 | $229,868 | $47,094 | $182,774 |
| 2020 | $624 | $42,813 | $42,813 | $0 |
| 2019 | $0 | $42,813 | $42,813 | $0 |
Source: Public Records
Map
Nearby Homes
- 1151 N 640 E Unit 105
- 1163 N 640 E Unit 106
- 1163 N 640 E
- 1135 N 640 E Unit 104
- 1135 N 640 E
- 1162 N 600 E
- 1146 N 600 E
- 1177 N 640 E Unit 107
- 1177 N 640 E
- 1176 N 600 E
- 1132 N 600 E
- 1119 N 640 E Unit 103
- 1156 N 640 E
- 1142 N 640 E
- 1172 N 640 E
- 1192 N 600 E
- 1116 N 600 E
- 1126 N 640 E
- 1195 N 640 E Unit 108
- 1105 N 640 E
Your Personal Tour Guide
Ask me questions while you tour the home.