1151 Posey Rd Newnan, GA 30265
Estimated payment $15,212/month
About This Lot
The Property offers the following attributes:
Excellent location being just over 6 miles from Downtown Newnan, offering an array of dining, retail and entertainment.
Located just over 4 miles from Ashley Park, a major mixed use development containing retail, commercial, restaurants, entertainment and recreational and health facilities and hotels.
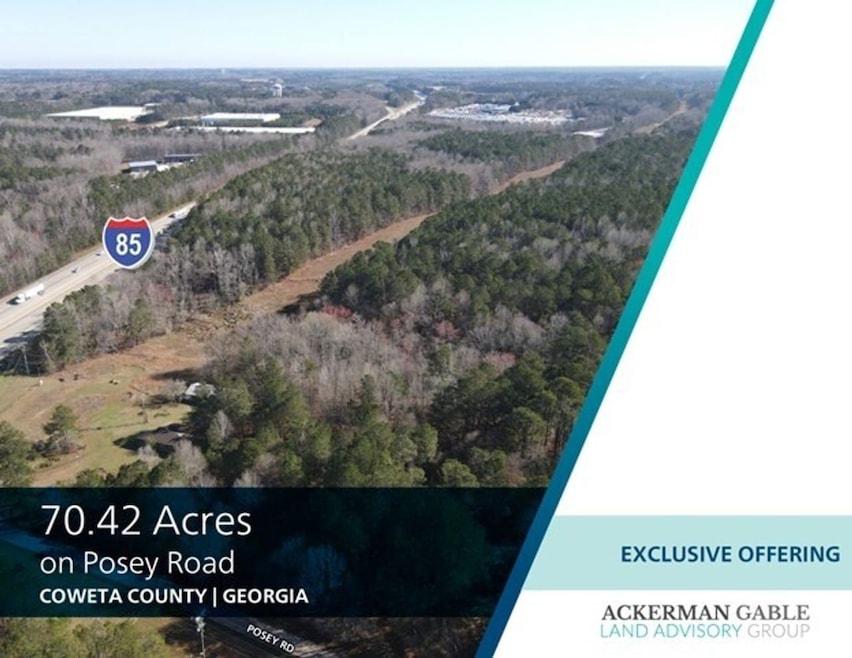
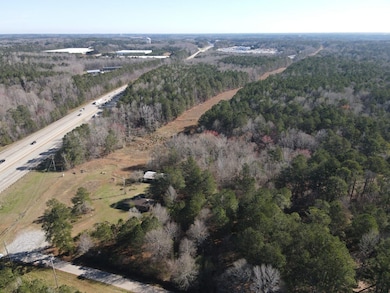
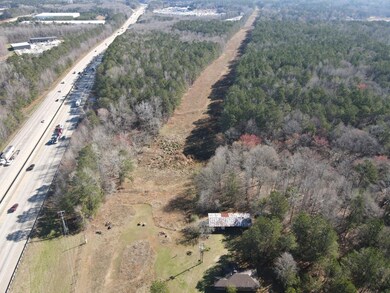
Convenient access to Interstate 85, as The Property is located less than 3 miles from the I-85/Sharpsburg McCullum Road interchange.
Just north of the future Del Webb Newnan development with almost 1,000 age-restricted units.
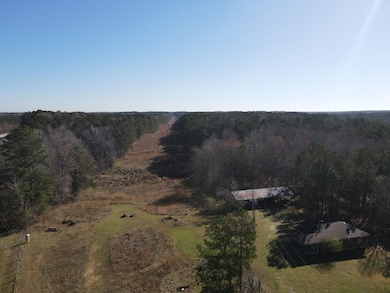
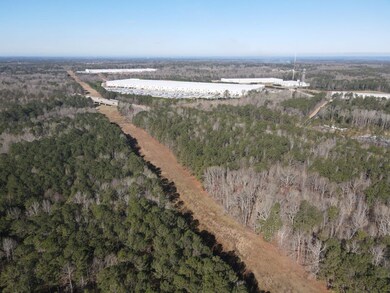
The Property has over 470 feet of frontage on Posey Road.
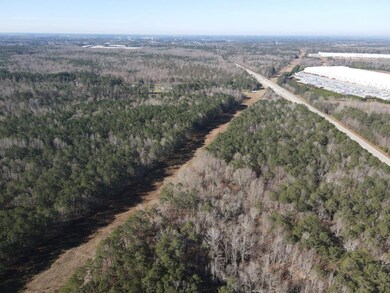
Over 1,900 feet of frontage on I-85 which carries a traffic count of 81,600 vehicles per day.
The majority of property is in the Complete Communities area with some of The Property being in the Employment Center-Industrial character area for the future land use.

Property Details
Property Type
- Land
Est. Annual Taxes
- $4,390
Lot Details
- Current uses include commercial
- Potential uses include for development
Map
Home Values in the Area
Average Home Value in this Area
Tax History
| Year | Tax Paid | Tax Assessment Tax Assessment Total Assessment is a certain percentage of the fair market value that is determined by local assessors to be the total taxable value of land and additions on the property. | Land | Improvement |
|---|---|---|---|---|
| 2025 | $4,390 | $185,818 | $164,950 | $20,869 |
| 2024 | $3,852 | $165,944 | $144,779 | $21,165 |
| 2023 | $3,852 | $163,434 | $144,779 | $18,654 |
| 2022 | $3,882 | $157,578 | $140,648 | $16,930 |
| 2021 | $3,919 | $148,849 | $133,951 | $14,898 |
| 2020 | $3,945 | $148,849 | $133,951 | $14,898 |
| 2019 | $5,042 | $172,266 | $168,514 | $3,752 |
| 2018 | $5,051 | $172,266 | $168,514 | $3,752 |
| 2017 | $5,049 | $172,266 | $168,514 | $3,752 |
| 2016 | $4,989 | $172,266 | $168,514 | $3,752 |
| 2015 | $4,904 | $172,266 | $168,514 | $3,752 |
| 2014 | $4,865 | $172,266 | $168,514 | $3,752 |
Property History
| Date | Event | Price | List to Sale | Price per Sq Ft |
|---|---|---|---|---|
| 10/28/2025 10/28/25 | Price Changed | $2,816,800 | -5.2% | -- |
| 04/25/2024 04/25/24 | For Sale | $2,970,800 | -- | -- |
Purchase History
| Date | Type | Sale Price | Title Company |
|---|---|---|---|
| Warranty Deed | -- | -- | |
| Quit Claim Deed | -- | -- |
- 75 Spring Ridge Ct
- 385 Windermere Cir
- 217 Windermere Cir
- 214 Daybreak Ln
- 0 Forest Berry Ct Unit LT76M2A 10293833
- 0 Forest Berry Ct Unit LT80M2A 10293886
- 0 Green Terrace Unit 10546475
- 0 Forest Berry Ct Unit LT77M2A 10293871
- 0 Forest Berry Ct Unit LT71M2A 10292471
- 75 Arbor Garden Cir
- 273 George Coggin Rd
- 68 Vale Point
- LOT20A Tanglewood Rd
- 42 Cypress Trail
- 44 S Arbor Shores
- 10 Posey Ridge Ct
- 10 Baker Rd
- 53 Vinings Trace
- 167 S Arbor Shores
- 84 Woodcliff Ct
- 37 Seven Pines Cir
- 55 Pilgrim Way
- 209 Walt Sanders Rd Unit A
- 20 Homeport Dr
- 10 General Longstreet Line
- 14 Hiram Dr
- 50 Pinehaven Dr
- 30 Cade Ct
- 45 Paces Landing Dr
- 311 Cranford Mill Dr
- 238 Manchester Dr Unit S Crouse
- 73 Elys Ridge
- 17 Forest Cir
- 22 Forest Cir
- 25 Elberta Dr
- 672 Andrew Bailey Rd
- 10 Lakeside Way
- 17 Stonemount Ct
- 51 Bradford Station Dr
- 105 Pemberton Place