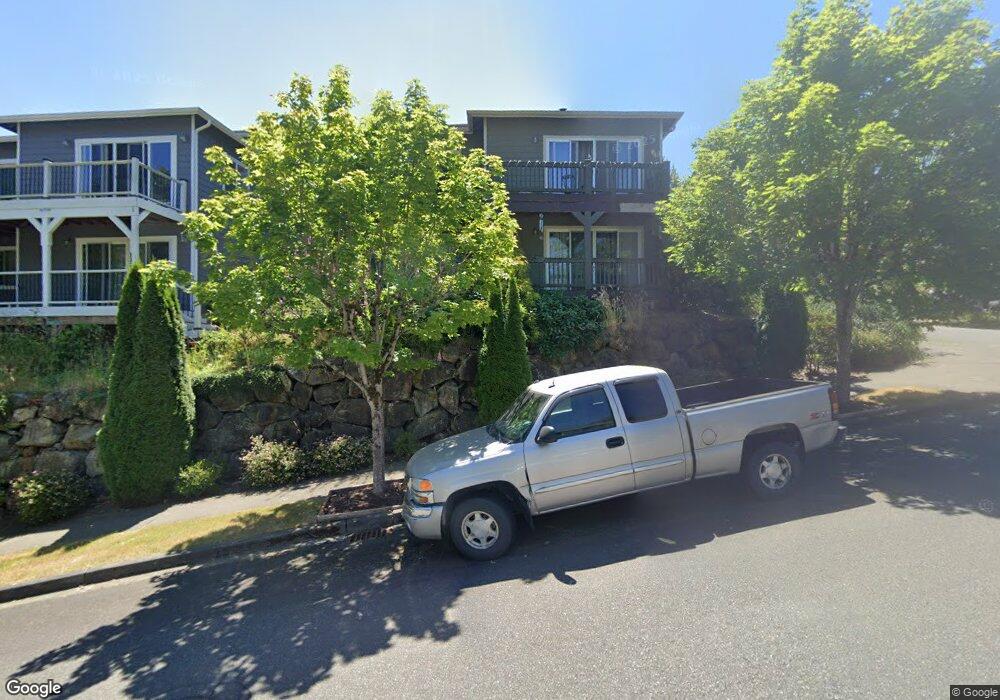
11510 34th St NE Lake Stevens, WA 98258
Old Town Lake Stevens NeighborhoodEstimated Value: $835,000 - $921,504
3
Beds
3
Baths
3,404
Sq Ft
$257/Sq Ft
Est. Value
About This Home
This home is located at 11510 34th St NE, Lake Stevens, WA 98258 and is currently estimated at $875,626, approximately $257 per square foot. 11510 34th St NE is a home located in Snohomish County with nearby schools including Highland Elementary School, North Lake Middle School, and Cavelero Mid High School.
Ownership History
Date
Name
Owned For
Owner Type
Purchase Details
Closed on
May 22, 2012
Sold by
Harrison Cory D and Harrison Melissa J
Bought by
Chase Jenica L and Norris Paul C
Current Estimated Value
Home Financials for this Owner
Home Financials are based on the most recent Mortgage that was taken out on this home.
Original Mortgage
$249,287
Outstanding Balance
$170,433
Interest Rate
3.62%
Mortgage Type
FHA
Estimated Equity
$705,193
Purchase Details
Closed on
Jul 11, 2006
Sold by
Ray Moore Construction Inc
Bought by
Harrison Cory D and Harrison Melissa J
Home Financials for this Owner
Home Financials are based on the most recent Mortgage that was taken out on this home.
Original Mortgage
$417,000
Interest Rate
6.66%
Mortgage Type
VA
Create a Home Valuation Report for This Property
The Home Valuation Report is an in-depth analysis detailing your home's value as well as a comparison with similar homes in the area
Home Values in the Area
Average Home Value in this Area
Purchase History
| Date | Buyer | Sale Price | Title Company |
|---|---|---|---|
| Chase Jenica L | $279,414 | First American | |
| Harrison Cory D | $446,000 | Pnwt |
Source: Public Records
Mortgage History
| Date | Status | Borrower | Loan Amount |
|---|---|---|---|
| Open | Chase Jenica L | $249,287 | |
| Previous Owner | Harrison Cory D | $417,000 |
Source: Public Records
Tax History Compared to Growth
Tax History
| Year | Tax Paid | Tax Assessment Tax Assessment Total Assessment is a certain percentage of the fair market value that is determined by local assessors to be the total taxable value of land and additions on the property. | Land | Improvement |
|---|---|---|---|---|
| 2025 | $6,964 | $782,600 | $288,100 | $494,500 |
| 2024 | $6,964 | $758,800 | $282,000 | $476,800 |
| 2023 | $6,623 | $781,500 | $294,000 | $487,500 |
| 2022 | $6,213 | $605,600 | $215,000 | $390,600 |
| 2020 | $5,578 | $508,400 | $183,000 | $325,400 |
| 2019 | $5,239 | $469,500 | $164,000 | $305,500 |
| 2018 | $5,204 | $427,200 | $140,000 | $287,200 |
| 2017 | $4,178 | $387,700 | $119,000 | $268,700 |
| 2016 | $4,119 | $355,400 | $107,000 | $248,400 |
| 2015 | $4,473 | $359,300 | $96,000 | $263,300 |
| 2013 | $4,343 | $306,400 | $85,000 | $221,400 |
Source: Public Records
Map
Nearby Homes
- 11608 34th St NE
- 3309 114th Dr NE
- 11848 33rd Place NE
- 12101 30th St NE
- 12203 30th St NE
- 10909 33rd Place NE
- 11501 25th St NE
- 3319 104th Ave NE
- 12611 37th Place NE
- 2224 114th Ave NE
- 3311 104th Ave NE
- 3303 103rd Dr NE
- 2509 Callow Rd
- 12104 22nd St NE
- 2004 120th Ave SE
- 11413 20th St NE Unit 5
- 3428 99th Ave NE
- 12203 N Lakeshore Dr
- 2002 127th Dr NE
- 2506 101st Ave NE
- 11514 34th St NE
- 11518 34th St NE
- 3335 116th Ave NE
- 3336 116th Ave NE
- 3338 116th Ave NE
- 11505 34th St NE
- 11509 34th St NE
- 3331 116th Ave NE
- 11501 34th St NE
- 11600 34th St NE
- 11513 34th St NE
- 11517 34th St NE
- 11601 33rd Ct NE
- 3323 116th Ave NE
- 11604 34th St NE
- 3400 Doe Way
- 3334 Baker Vista Ln
- 3319 116th Ave NE
- 11605 33rd Ct NE
- 3330 Baker Vista Ln