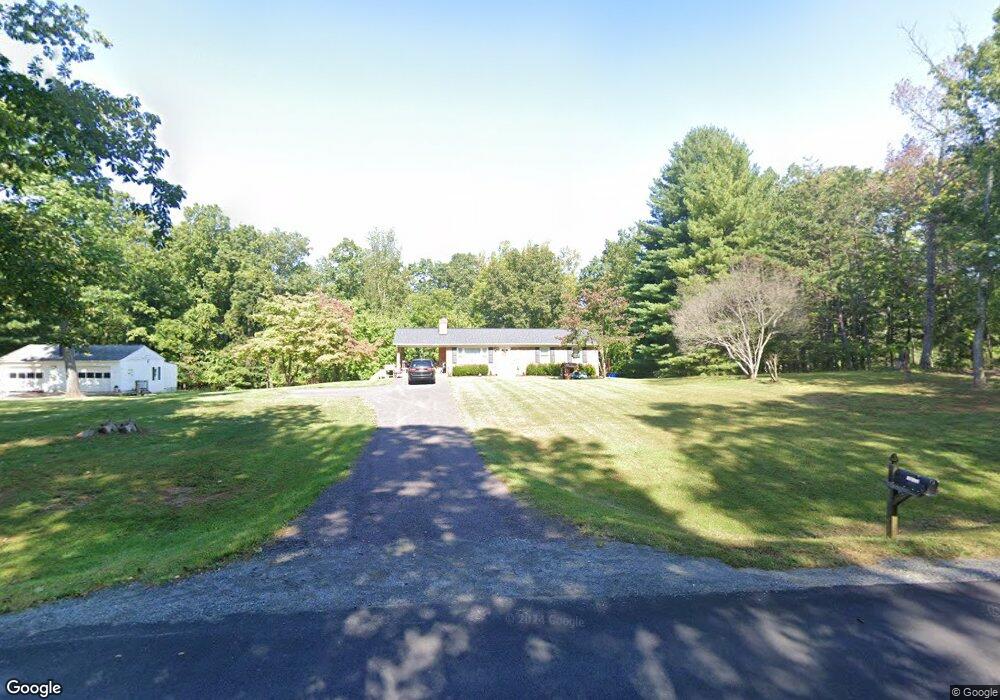
11510 Alum Springs Rd Rixeyville, VA 22737
Estimated Value: $379,000 - $484,000
4
Beds
2
Baths
2,314
Sq Ft
$183/Sq Ft
Est. Value
About This Home
This home is located at 11510 Alum Springs Rd, Rixeyville, VA 22737 and is currently estimated at $422,818, approximately $182 per square foot. 11510 Alum Springs Rd is a home located in Culpeper County with nearby schools including Emerald Hill Elementary School, Culpeper Middle School, and Culpeper County High School.
Ownership History
Date
Name
Owned For
Owner Type
Purchase Details
Closed on
Jul 29, 2019
Sold by
Us Bank Na
Bought by
Jenkins Donald L and Heflin Ashlee
Current Estimated Value
Home Financials for this Owner
Home Financials are based on the most recent Mortgage that was taken out on this home.
Original Mortgage
$189,905
Outstanding Balance
$79,767
Interest Rate
3.8%
Mortgage Type
New Conventional
Estimated Equity
$343,051
Purchase Details
Closed on
Mar 19, 2019
Sold by
Samuel I White Pc
Bought by
Us Bank Na and The Rmac Trust Series 2016-Ctt
Purchase Details
Closed on
Mar 6, 2008
Sold by
Booth Robert O
Bought by
Zopp Buster Curtis
Home Financials for this Owner
Home Financials are based on the most recent Mortgage that was taken out on this home.
Original Mortgage
$270,000
Interest Rate
5.57%
Mortgage Type
New Conventional
Create a Home Valuation Report for This Property
The Home Valuation Report is an in-depth analysis detailing your home's value as well as a comparison with similar homes in the area
Home Values in the Area
Average Home Value in this Area
Purchase History
| Date | Buyer | Sale Price | Title Company |
|---|---|---|---|
| Jenkins Donald L | $199,900 | Entitle Settlement Services | |
| Us Bank Na | $216,604 | None Available | |
| Zopp Buster Curtis | $270,000 | -- |
Source: Public Records
Mortgage History
| Date | Status | Borrower | Loan Amount |
|---|---|---|---|
| Open | Jenkins Donald L | $189,905 | |
| Previous Owner | Zopp Buster Curtis | $270,000 |
Source: Public Records
Tax History Compared to Growth
Tax History
| Year | Tax Paid | Tax Assessment Tax Assessment Total Assessment is a certain percentage of the fair market value that is determined by local assessors to be the total taxable value of land and additions on the property. | Land | Improvement |
|---|---|---|---|---|
| 2025 | $1,706 | $396,700 | $123,100 | $273,600 |
| 2024 | $1,706 | $353,800 | $93,100 | $260,700 |
| 2023 | $1,627 | $353,800 | $93,100 | $260,700 |
| 2022 | $1,571 | $285,600 | $78,100 | $207,500 |
| 2021 | $1,571 | $285,600 | $78,100 | $207,500 |
| 2020 | $1,578 | $254,500 | $66,500 | $188,000 |
| 2019 | $1,209 | $253,700 | $66,500 | $187,200 |
| 2018 | $1,490 | $222,400 | $63,200 | $159,200 |
| 2017 | $1,490 | $222,400 | $63,200 | $159,200 |
| 2016 | $1,481 | $217,500 | $58,300 | $159,200 |
| 2015 | $1,481 | $202,900 | $58,300 | $144,600 |
| 2014 | $1,516 | $182,700 | $53,500 | $129,200 |
Source: Public Records
Map
Nearby Homes
- 11068 Alum Springs Rd
- 10771 Peaceful Woods Ln
- 11400 Alvin Ln
- 13013 Alum Springs Rd
- 10704 Rixeyville Rd
- 10674 Rixeyville Rd
- 12147 Stonehouse Mountain Rd
- 10643 Settle School Rd
- 12494 Eggbornsville Rd
- 12564 Eggbornsville Rd
- 9324 Rixeyville Rd
- 13616 Eggbornsville Rd
- 0 Jamesons Mill Rd 31-92-e Unit VACU2010290
- 12252 Randle Ln
- 9106 Bell Mare Ln
- 4 Bell Mare Ln
- 2 Bell Mare Ln
- 1 Bell Mare Ln
- 9076 Bell Mare Ln
- 3 Bell Mare Ln
- 11486 Alum Springs Rd
- 11536 Alum Springs Rd
- 11537 Alum Springs Rd
- 11400 Alum Springs Rd
- 11600 Alum Springs Rd
- 11464 Alum Springs Rd
- 11471 Alum Springs Rd
- 11575 Alum Springs Rd
- 11434 Alum Springs Rd
- 11618 Alum Springs Rd
- 11595 Alum Springs Rd
- 11521 Alum Springs Rd
- 11497 Alum Springs Rd
- 11422 Alum Springs Rd
- 11108 Dutch Hollow Rd
- 11475 Alum Springs Rd
- 11607 Alum Springs Rd
- 11172 Dutch Hollow Rd
- 11080 Dutch Hollow Rd
- 11058 Dutch Hollow Rd