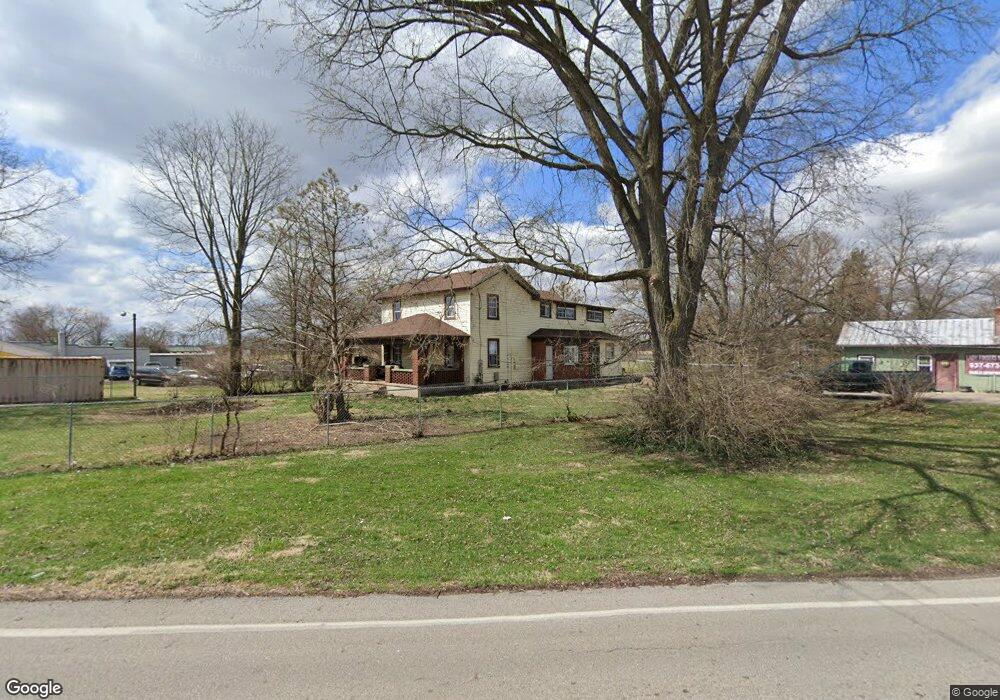
11510 Lower Valley Pike Medway, OH 45341
Estimated Value: $274,577 - $381,000
4
Beds
2
Baths
3,159
Sq Ft
$98/Sq Ft
Est. Value
About This Home
This home is located at 11510 Lower Valley Pike, Medway, OH 45341 and is currently estimated at $308,894, approximately $97 per square foot. 11510 Lower Valley Pike is a home located in Clark County with nearby schools including Park Layne Elementary School, Donnelsville Elementary School, and New Carlisle Elementary School.
Ownership History
Date
Name
Owned For
Owner Type
Purchase Details
Closed on
Jul 17, 2014
Sold by
Tittle David and Tittle Regina
Bought by
Board Of Clark County Commissioners
Current Estimated Value
Purchase Details
Closed on
Nov 20, 2009
Sold by
Federal Home Loan Mortgage Corporation
Bought by
Tittle David and Tittle Regina
Purchase Details
Closed on
Jul 25, 2008
Sold by
Cochran Bonnie L and Cochran Mark W
Bought by
Federal Home Loan Mortgage Corporation
Purchase Details
Closed on
Dec 10, 2001
Sold by
Country Rentals
Bought by
Cochran Mark W and Cochran Bonnie L
Home Financials for this Owner
Home Financials are based on the most recent Mortgage that was taken out on this home.
Original Mortgage
$100,000
Interest Rate
7.14%
Purchase Details
Closed on
Dec 20, 1996
Sold by
Brenda K Adkins
Bought by
Country Rentals
Create a Home Valuation Report for This Property
The Home Valuation Report is an in-depth analysis detailing your home's value as well as a comparison with similar homes in the area
Home Values in the Area
Average Home Value in this Area
Purchase History
| Date | Buyer | Sale Price | Title Company |
|---|---|---|---|
| Board Of Clark County Commissioners | $300 | Attorney | |
| Tittle David | $45,000 | None Available | |
| Federal Home Loan Mortgage Corporation | $56,667 | None Available | |
| Cochran Mark W | -- | -- | |
| Country Rentals | $80,000 | -- |
Source: Public Records
Mortgage History
| Date | Status | Borrower | Loan Amount |
|---|---|---|---|
| Previous Owner | Cochran Mark W | $100,000 |
Source: Public Records
Tax History Compared to Growth
Tax History
| Year | Tax Paid | Tax Assessment Tax Assessment Total Assessment is a certain percentage of the fair market value that is determined by local assessors to be the total taxable value of land and additions on the property. | Land | Improvement |
|---|---|---|---|---|
| 2024 | $3,214 | $68,190 | $11,460 | $56,730 |
| 2023 | $3,214 | $68,190 | $11,460 | $56,730 |
| 2022 | $3,220 | $68,190 | $11,460 | $56,730 |
| 2021 | $2,687 | $52,060 | $8,750 | $43,310 |
| 2020 | $2,694 | $52,060 | $8,750 | $43,310 |
| 2019 | $2,768 | $52,060 | $8,750 | $43,310 |
| 2018 | $2,251 | $40,050 | $8,750 | $31,300 |
| 2017 | $2,888 | $40,047 | $8,750 | $31,297 |
| 2016 | $2,143 | $40,047 | $8,750 | $31,297 |
| 2015 | $2,022 | $36,470 | $8,750 | $27,720 |
| 2014 | $2,012 | $36,491 | $8,771 | $27,720 |
| 2013 | $2,016 | $36,491 | $8,771 | $27,720 |
Source: Public Records
Map
Nearby Homes
- 11591 Lower Valley Pike
- 4065 Osborn Rd
- 851 Corvette Ave
- 870 Corvette Ave
- 1190 Shirra Ave
- 216 Braun St
- 321 Stratmore St
- 12206 Cordova Dr
- 1210 Campbell Ave
- 1115 Frayne Dr
- 108 N Park Dr
- 1143 Bookwalter Ave
- 518 Beach Dr
- 510 Bowser Dr
- 113 W Main St
- 1124 Burket Dr
- 1215 Chalet Dr
- 1616 Styer Dr
- 326 Kennedy Dr
- 1689 Dale Ridge Rd
- 11527 Wilts Ln
- 4511 Osborn Rd
- 11543 Wilts Ln
- 11557 Wilts Ln
- 4479 Osborn Rd
- 11571 Wilts Ln
- 11523 Lower Valley Pike
- 11540 Wilts Ln
- 11442 Lower Valley Pike
- 4461 Osborn Rd
- 11587 Wilts Ln
- 11568 Wilts Ln
- 4439 Osborn Rd
- 11547 Lower Valley Pike
- 4663 Osborn Rd
- 11582 Wilts Ln
- 11408 Lower Valley Pike
- 4430 Osborn Rd
- 4367 Osborn Rd
- 4341 Osborn Rd