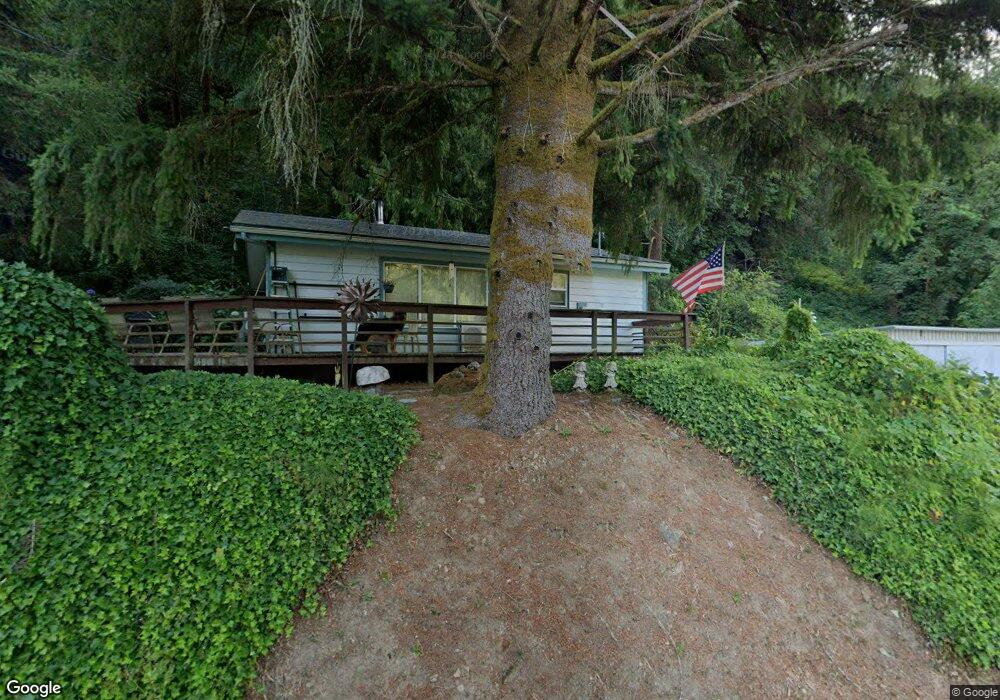
11512 E Mapleton Rd Mapleton, OR 97453
Estimated Value: $320,000 - $433,797
3
Beds
6
Baths
1,792
Sq Ft
$206/Sq Ft
Est. Value
About This Home
This home is located at 11512 E Mapleton Rd, Mapleton, OR 97453 and is currently estimated at $368,949, approximately $205 per square foot. 11512 E Mapleton Rd is a home located in Lane County with nearby schools including Mapleton Elementary School and Mapleton Junior/Senior High School.
Ownership History
Date
Name
Owned For
Owner Type
Purchase Details
Closed on
Jun 10, 2013
Sold by
Bakalish Robert and Bakalish Susan K
Bought by
Medlock Steve and Medlock Melinda
Current Estimated Value
Home Financials for this Owner
Home Financials are based on the most recent Mortgage that was taken out on this home.
Original Mortgage
$105,000
Interest Rate
3.32%
Mortgage Type
Seller Take Back
Purchase Details
Closed on
Aug 21, 2003
Sold by
Greer James S
Bought by
Bakalish Robert and Bakalish Susan K
Purchase Details
Closed on
Sep 4, 1998
Sold by
Greer James S
Bought by
Wall Mary Yvonne
Home Financials for this Owner
Home Financials are based on the most recent Mortgage that was taken out on this home.
Original Mortgage
$30,000
Interest Rate
6.93%
Mortgage Type
Seller Take Back
Purchase Details
Closed on
Nov 24, 1992
Sold by
Ferguson Kip
Bought by
Greer James S
Create a Home Valuation Report for This Property
The Home Valuation Report is an in-depth analysis detailing your home's value as well as a comparison with similar homes in the area
Purchase History
| Date | Buyer | Sale Price | Title Company |
|---|---|---|---|
| Medlock Steve | $120,000 | Cascade Title Co | |
| Bakalish Robert | $115,000 | Western Pioneer Title Co | |
| Wall Mary Yvonne | $30,001 | Western Pioneer Title Co | |
| Greer James S | $59,500 | Western Pioneer Title Co |
Source: Public Records
Mortgage History
| Date | Status | Borrower | Loan Amount |
|---|---|---|---|
| Closed | Medlock Steve | $105,000 | |
| Previous Owner | Wall Mary Yvonne | $30,000 |
Source: Public Records
Tax History
| Year | Tax Paid | Tax Assessment Tax Assessment Total Assessment is a certain percentage of the fair market value that is determined by local assessors to be the total taxable value of land and additions on the property. | Land | Improvement |
|---|---|---|---|---|
| 2025 | $1,882 | $148,919 | -- | -- |
| 2024 | $1,819 | $144,582 | -- | -- |
| 2023 | $1,819 | $140,371 | $0 | $0 |
| 2022 | $1,698 | $136,283 | $0 | $0 |
| 2021 | $1,658 | $132,314 | $0 | $0 |
| 2020 | $1,608 | $128,461 | $0 | $0 |
| 2019 | $1,549 | $124,720 | $0 | $0 |
| 2018 | $1,496 | $117,561 | $0 | $0 |
| 2017 | $1,530 | $117,561 | $0 | $0 |
| 2016 | $1,487 | $114,137 | $0 | $0 |
| 2015 | $1,317 | $110,813 | $0 | $0 |
| 2014 | $1,296 | $107,585 | $0 | $0 |
Source: Public Records
Map
Nearby Homes
- 11445 E Mapleton Rd
- 11425 E Mapleton Rd
- 11406 E Mapleton Rd
- 11354 Highway 36
- 11354 Highway 36 Unit LotWP001
- 10919 E Mapleton Rd
- 10887 E Mapleton Rd
- 10786 Oregon 126
- 10298 Highway 126
- 12407 Highway 36
- 10195 Sweet Creek Rd
- 87606 Rice Rd
- 9580 N Fork Siuslaw Rd
- 87511 Tiernan Rd
- 0 Tiernan Rd Unit 2000 366995926
- 0 Tiernan Rd Unit 100
- 9247 Highway 126
- 89731 Indian Creek Rd
- 0 N Fork Rd Unit 770119425
- 13904 Stagecoach Rd
- 11508 E Mapleton Rd
- 11517 E Mapleton Rd
- 0 Tax Id: 0533446 Unit 24455206
- 0 Tax Id: 0533446 Unit 23593622
- 11525 E Mapleton Rd
- 11557 E Mapleton Rd
- 11488 E Mapleton Rd
- 0 E Mapleton Rd Unit 22489650
- 0 E Mapleton Rd Unit TL300 20229137
- 0 E Mapleton Rd Unit TL200 19469130
- 0 E Mapleton Rd Unit 1100 12649149
- 0 E Mapleton Rd Unit TL200 15433872
- 0 E Mapleton Rd Unit 1100 16569522
- 0 E Mapleton Rd Unit TL200
- 11460 E Mapleton Rd
- 11521 Highway 36
- 11493 Highway 36
- 11401 E Mapleton Rd
- 11381 E Mapleton Rd
- 11621 Highway 36
Your Personal Tour Guide
Ask me questions while you tour the home.