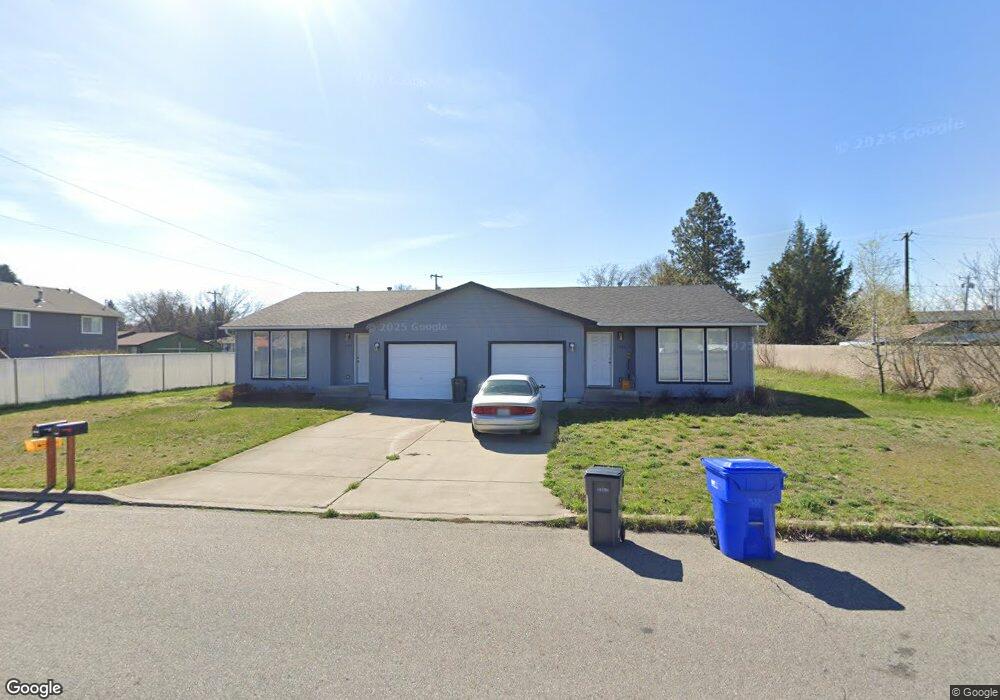
11512 E Railroad Ave Spokane Valley, WA 99206
Mirabeau NeighborhoodEstimated Value: $384,826 - $529,000
4
Beds
2
Baths
1,980
Sq Ft
$225/Sq Ft
Est. Value
About This Home
This home is located at 11512 E Railroad Ave, Spokane Valley, WA 99206 and is currently estimated at $444,957, approximately $224 per square foot. 11512 E Railroad Ave is a home located in Spokane County with nearby schools including Trent Elementary School, East Valley Middle School, and East Valley High School & Extension.
Ownership History
Date
Name
Owned For
Owner Type
Purchase Details
Closed on
Oct 11, 2019
Sold by
Carrington Mortgage Services Llc
Bought by
Trom Rick Steven and Trom Kimberly Ann
Current Estimated Value
Purchase Details
Closed on
Aug 13, 2019
Sold by
Lingg Veronica M and Lingg Jennifer N D
Bought by
Carrington Mortgage Services Llc
Purchase Details
Closed on
Feb 26, 2003
Sold by
Eveland Kib D and Eveland Valerie A
Bought by
Lingg Veronica M and Lingg Jennifer N D
Home Financials for this Owner
Home Financials are based on the most recent Mortgage that was taken out on this home.
Original Mortgage
$127,202
Interest Rate
5.85%
Mortgage Type
FHA
Purchase Details
Closed on
Oct 27, 1998
Sold by
Homestead Construction Inc
Bought by
Eveland Kib D and Eveland Valerie A
Home Financials for this Owner
Home Financials are based on the most recent Mortgage that was taken out on this home.
Original Mortgage
$81,900
Interest Rate
6.6%
Create a Home Valuation Report for This Property
The Home Valuation Report is an in-depth analysis detailing your home's value as well as a comparison with similar homes in the area
Home Values in the Area
Average Home Value in this Area
Purchase History
| Date | Buyer | Sale Price | Title Company |
|---|---|---|---|
| Trom Rick Steven | $168,007 | Ticor | |
| Carrington Mortgage Services Llc | $178,000 | Accommodation | |
| Lingg Veronica M | $129,000 | Spokane County Title Co | |
| Eveland Kib D | $117,000 | Transnation Title Insurance |
Source: Public Records
Mortgage History
| Date | Status | Borrower | Loan Amount |
|---|---|---|---|
| Previous Owner | Lingg Veronica M | $127,202 | |
| Previous Owner | Eveland Kib D | $81,900 |
Source: Public Records
Tax History
| Year | Tax Paid | Tax Assessment Tax Assessment Total Assessment is a certain percentage of the fair market value that is determined by local assessors to be the total taxable value of land and additions on the property. | Land | Improvement |
|---|---|---|---|---|
| 2025 | $2,953 | $381,500 | $120,000 | $261,500 |
| 2024 | $2,953 | $306,900 | $82,000 | $224,900 |
| 2023 | $3,033 | $317,300 | $72,000 | $245,300 |
| 2022 | $2,696 | $317,300 | $72,000 | $245,300 |
| 2021 | $2,544 | $212,800 | $40,000 | $172,800 |
| 2020 | $2,429 | $192,500 | $34,500 | $158,000 |
| 2019 | $2,105 | $170,500 | $34,500 | $136,000 |
| 2018 | $2,218 | $167,400 | $34,500 | $132,900 |
| 2017 | $1,898 | $143,800 | $30,000 | $113,800 |
| 2016 | $1,697 | $129,400 | $30,000 | $99,400 |
| 2015 | $1,732 | $127,400 | $27,000 | $100,400 |
| 2014 | -- | $127,400 | $27,000 | $100,400 |
| 2013 | -- | $0 | $0 | $0 |
Source: Public Records
Map
Nearby Homes
- 11316 E Grace Ave
- 11414 E Coyote Rock Dr
- 11422 E Coyote Rock Dr
- 11406 E Coyote Rock Dr
- 11610 E Rivercrest Dr
- 11708 E Rivercrest Dr
- 2722 N Fox Rd
- 11722 E Jackson Ln
- 11616 E Jackson Ave
- 10807 E Trent Ave
- 12011 E Mansfield Ave
- 12017 E Mansfield Ave
- 6XX S Robie St
- 11920 E Mansfield Ave Unit 35
- 11920 E Mansfield Ave Unit 93
- 11920 E Mansfield Ave Unit 94
- 11920 E Mansfield Ave Unit 47
- 11920 E Mansfield Ave Unit 74
- 11920 E Mansfield Ave Unit 90
- 11920 E Mansfield Ave Unit 111
- 3215 N Bates Ct
- 3210 N Bowdish Rd
- 11515 E Frederick Ave
- 11509 E Frederick Ave
- 3207 N Bates Ct
- 11521 E Frederick Ave
- 11503 E Frederick Ave
- 11601 E Frederick Ave
- 3121 N Bowdish Rd
- 11607 E Frederick Ave
- 3208 N Bates Ct
- 3216 N Bates Ct
- 3115 N Bowdish Rd
- 11510 E Frederick Ave
- 11516 E Frederick Ave
- 11613 E Frederick Ave
- 11504 E Frederick Ave
- 11524 E Frederick Ave
- 11412 E Railroad Ave
- 3213 N Wilbur Ct