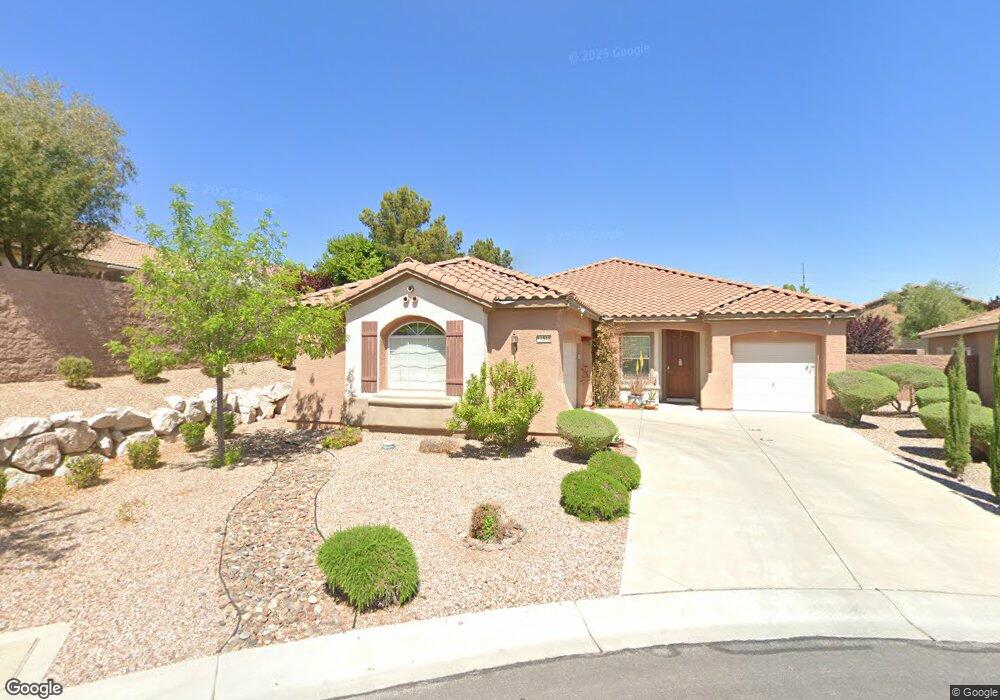
11512 Lone Point Ct Las Vegas, NV 89138
Estimated Value: $756,464 - $841,000
4
Beds
2
Baths
2,238
Sq Ft
$352/Sq Ft
Est. Value
About This Home
This home is located at 11512 Lone Point Ct, Las Vegas, NV 89138 and is currently estimated at $788,366, approximately $352 per square foot. 11512 Lone Point Ct is a home located in Clark County with nearby schools including Linda Rankin Givens Elementary School, Sig Rogich Middle School, and Palo Verde High School.
Ownership History
Date
Name
Owned For
Owner Type
Purchase Details
Closed on
Jan 30, 2017
Sold by
Cohen Jean J
Bought by
Smith Sean M and Smith Kim M
Current Estimated Value
Home Financials for this Owner
Home Financials are based on the most recent Mortgage that was taken out on this home.
Original Mortgage
$346,500
Outstanding Balance
$286,566
Interest Rate
4.16%
Mortgage Type
New Conventional
Estimated Equity
$501,800
Purchase Details
Closed on
Jun 21, 2012
Sold by
Cohen Jean L
Bought by
Cohen Jean L
Purchase Details
Closed on
Apr 6, 2007
Sold by
Cohen Jean L and Cohen Marcia A
Bought by
Cohen Jean L and The Jean L Cohen Revocable Living Trust
Purchase Details
Closed on
Jun 6, 2003
Sold by
William Lyon Homes Inc
Bought by
Cohen Jean L and Cohen Marcia A
Home Financials for this Owner
Home Financials are based on the most recent Mortgage that was taken out on this home.
Original Mortgage
$210,800
Interest Rate
5.71%
Mortgage Type
Unknown
Create a Home Valuation Report for This Property
The Home Valuation Report is an in-depth analysis detailing your home's value as well as a comparison with similar homes in the area
Home Values in the Area
Average Home Value in this Area
Purchase History
| Date | Buyer | Sale Price | Title Company |
|---|---|---|---|
| Smith Sean M | $385,000 | Ticor Title Las Vegas | |
| Cohen Jean L | -- | None Available | |
| Cohen Jean L | -- | None Available | |
| Cohen Jean L | $263,505 | Fidelity National Title |
Source: Public Records
Mortgage History
| Date | Status | Borrower | Loan Amount |
|---|---|---|---|
| Open | Smith Sean M | $346,500 | |
| Previous Owner | Cohen Jean L | $210,800 |
Source: Public Records
Tax History Compared to Growth
Tax History
| Year | Tax Paid | Tax Assessment Tax Assessment Total Assessment is a certain percentage of the fair market value that is determined by local assessors to be the total taxable value of land and additions on the property. | Land | Improvement |
|---|---|---|---|---|
| 2025 | $3,916 | $189,613 | $91,700 | $97,913 |
| 2024 | $3,802 | $189,613 | $91,700 | $97,913 |
| 2023 | $3,098 | $156,480 | $64,050 | $92,430 |
| 2022 | $3,691 | $140,223 | $55,650 | $84,573 |
| 2021 | $3,582 | $129,518 | $49,350 | $80,168 |
| 2020 | $3,475 | $126,049 | $46,550 | $79,499 |
| 2019 | $3,372 | $121,787 | $43,750 | $78,037 |
| 2018 | $3,272 | $111,837 | $36,750 | $75,087 |
| 2017 | $3,573 | $108,811 | $32,900 | $75,911 |
| 2016 | $3,098 | $102,468 | $26,950 | $75,518 |
| 2015 | $3,092 | $100,615 | $26,950 | $73,665 |
| 2014 | $3,001 | $88,626 | $16,555 | $72,071 |
Source: Public Records
Map
Nearby Homes
- 11589 Caldicot Dr
- 12230 Elderwood St
- 454 Carter House Ave
- 489 Carter House Ave
- 11550 Lampeter Ct
- 213 Villa Borghese St
- 11269 Emerald Pine Ln
- 238 Little Haystack Dr
- 508 Carter House Ave
- 11672 Barga Ct
- 11554 Trevi Fountain Ave
- 298 Nine Mile Creek Dr
- 11831 Giroma Ave
- 281 Gandara St
- 169 Pioneer Peak Place
- 216 Muldowney Ln
- 11249 Revelry Ln
- 11730 Stonewall Springs Ave
- 225 Robledo St
- 382 Badwater Basin St
- 11508 Lone Point Ct
- 80 Escondido Canyon St
- 76 Escondido Canyon St
- 84 Escondido Canyon St
- 84 Escondido Canyon St Unit n/a
- 11504 Lone Point Ct
- 11517 Cannon Falls Ave
- 68 Escondido Canyon St
- 11513 Cannon Falls Ave Unit 4
- 88 Escondido Canyon St
- 11509 Cannon Falls Ave
- 64 Escondido Canyon St Unit 4
- 11500 Lone Point Ct
- 11500 Lone Point Ct Unit n/a
- 11509 Lone Point Ct Unit 2
- 11505 Cannon Falls Ave
- 11505 Lone Point Ct
- 92 Escondido Canyon St Unit 2
- 92 Escondido Canyon St
- 81 Escondido Canyon St Unit 2