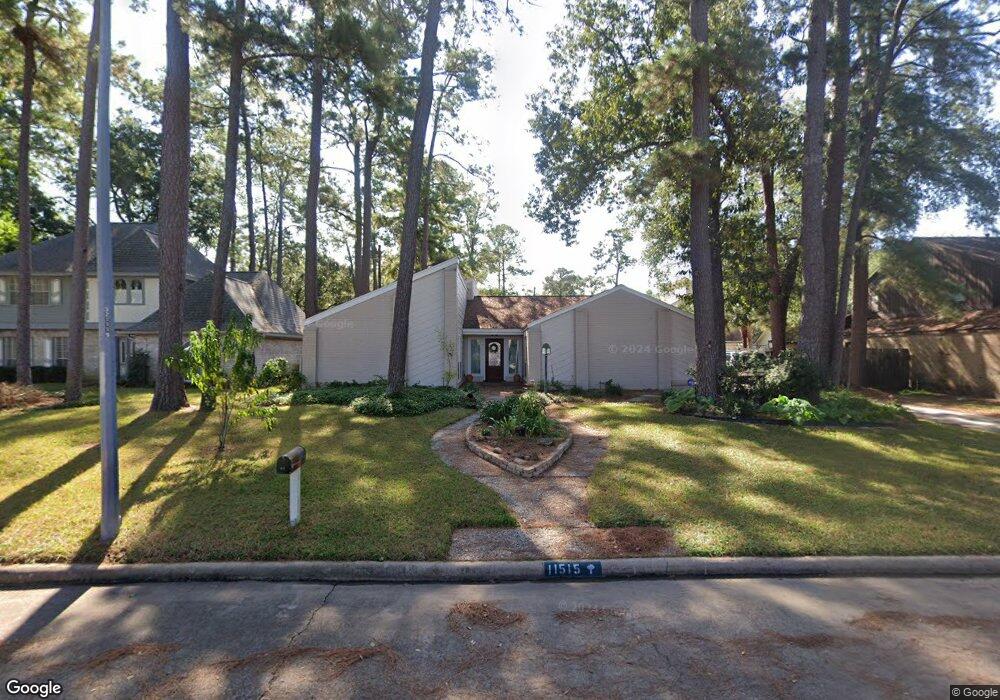
11515 Quail Creek Dr Houston, TX 77070
Estimated Value: $316,000 - $343,000
4
Beds
2
Baths
2,380
Sq Ft
$139/Sq Ft
Est. Value
About This Home
This home is located at 11515 Quail Creek Dr, Houston, TX 77070 and is currently estimated at $330,626, approximately $138 per square foot. 11515 Quail Creek Dr is a home located in Harris County with nearby schools including Moore Elementary School, Hamilton Middle School, and Cypress Creek High School.
Ownership History
Date
Name
Owned For
Owner Type
Purchase Details
Closed on
Dec 18, 1997
Sold by
Stewart Barbara Lussier and Stewart Charles P
Bought by
Allred Robert D and Allred Jean M
Current Estimated Value
Home Financials for this Owner
Home Financials are based on the most recent Mortgage that was taken out on this home.
Original Mortgage
$111,150
Outstanding Balance
$18,788
Interest Rate
7.22%
Estimated Equity
$311,838
Purchase Details
Closed on
May 26, 1995
Sold by
Micheletti Steven E and Micheletti Janet E
Bought by
Stewart Barbara Lussier
Home Financials for this Owner
Home Financials are based on the most recent Mortgage that was taken out on this home.
Original Mortgage
$72,000
Interest Rate
7.41%
Create a Home Valuation Report for This Property
The Home Valuation Report is an in-depth analysis detailing your home's value as well as a comparison with similar homes in the area
Home Values in the Area
Average Home Value in this Area
Purchase History
| Date | Buyer | Sale Price | Title Company |
|---|---|---|---|
| Allred Robert D | -- | -- | |
| Stewart Barbara Lussier | -- | Chicago Title | |
| Stewart Barbara Lynn | -- | Chicago Title | |
| Stewart Barbara Lynn | -- | Chicago Title |
Source: Public Records
Mortgage History
| Date | Status | Borrower | Loan Amount |
|---|---|---|---|
| Open | Allred Robert D | $111,150 | |
| Previous Owner | Stewart Barbara Lynn | $72,000 |
Source: Public Records
Tax History Compared to Growth
Tax History
| Year | Tax Paid | Tax Assessment Tax Assessment Total Assessment is a certain percentage of the fair market value that is determined by local assessors to be the total taxable value of land and additions on the property. | Land | Improvement |
|---|---|---|---|---|
| 2025 | $961 | $269,500 | $87,500 | $182,000 |
| 2024 | $961 | $287,267 | $87,500 | $199,767 |
| 2023 | $961 | $296,949 | $87,500 | $209,449 |
| 2022 | $5,152 | $260,054 | $70,000 | $190,054 |
| 2021 | $4,934 | $214,817 | $67,900 | $146,917 |
| 2020 | $4,636 | $187,000 | $47,500 | $139,500 |
| 2019 | $3,102 | $148,369 | $44,500 | $103,869 |
| 2018 | $904 | $109,754 | $50,000 | $59,754 |
| 2017 | $4,716 | $183,885 | $50,000 | $133,885 |
| 2016 | $4,879 | $197,393 | $50,000 | $147,393 |
| 2015 | $3,079 | $181,305 | $40,000 | $141,305 |
| 2014 | $3,079 | $161,190 | $31,000 | $130,190 |
Source: Public Records
Map
Nearby Homes
- 11502 Primwood Dr
- 11515 Normont Dr
- 11723 Quail Creek Dr
- 11803 Pebbleton Dr
- 12 Lakeview Place
- 11807 Primwood Dr
- 11607 Knobcrest Dr
- 13911 Cypresswood Crossing Blvd
- 11602 Jaycreek Dr
- 14907 Pine Point Ct
- 11631 Jaycreek Dr
- 11906 Moorcreek Dr
- 10822 Normont Dr
- 11715 Park Creek Dr
- 11730 Cypresswood Dr
- 13714 Cypresswood Crossing Blvd
- 11715 Cypresswood Dr
- 14615 Sunny Grove Dr
- 11410 Rothglen St
- 15118 Stillcreek Dr
- 11511 Quail Creek Dr
- 11519 Quail Creek Dr
- 11510 Primwood Dr
- 11514 Primwood Dr
- 11506 Primwood Dr
- 11523 Quail Creek Dr
- 11518 Quail Creek Dr
- 11518 Primwood Dr
- 11507 Quail Creek Dr
- 11510 Quail Creek Dr
- 11522 Quail Creek Dr
- 11503 Quail Creek Dr
- 11602 Primwood Dr
- 11603 Quail Creek Dr
- 11506 Quail Creek Dr
- 11602 Quail Creek Dr
- 11502 Quail Creek Dr
- 14130 Saddlebend Dr
- 11511 Primwood Dr
- 11515 Parkriver Dr