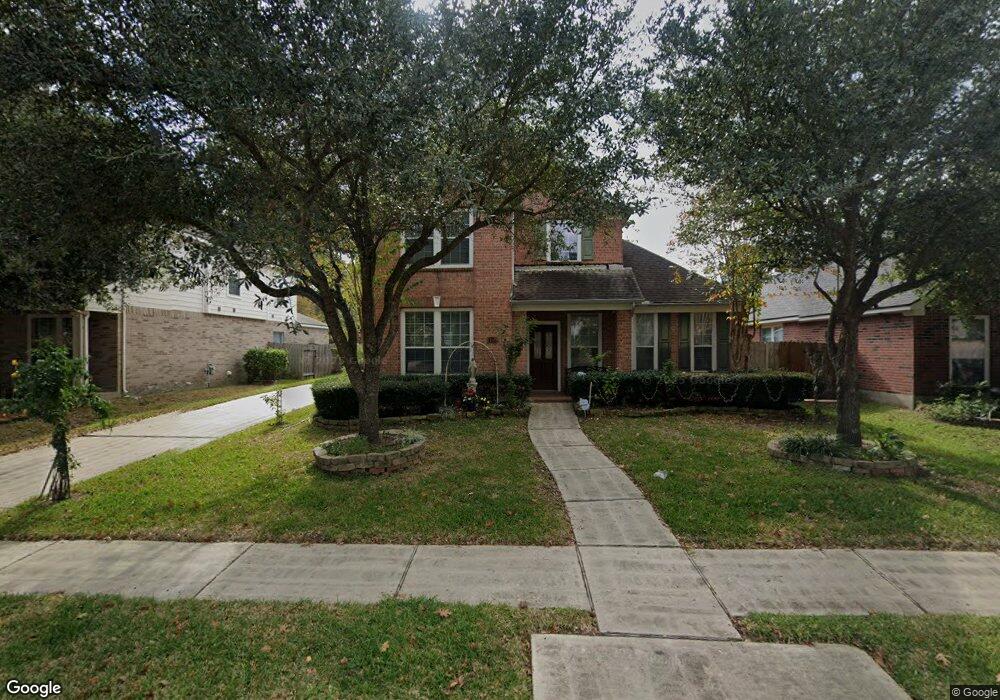
11519 Maple Falls Dr Tomball, TX 77377
Estimated Value: $369,000 - $381,033
4
Beds
3
Baths
2,382
Sq Ft
$159/Sq Ft
Est. Value
About This Home
This home is located at 11519 Maple Falls Dr, Tomball, TX 77377 and is currently estimated at $377,758, approximately $158 per square foot. 11519 Maple Falls Dr is a home located in Harris County with nearby schools including Lakewood Elementary School, Willow Wood Junior High School, and Northpointe Intermediate School.
Ownership History
Date
Name
Owned For
Owner Type
Purchase Details
Closed on
Feb 13, 2009
Sold by
Gmac Global Relocation Services Llc
Bought by
Nguyen Hung Q and Tran Tram
Current Estimated Value
Home Financials for this Owner
Home Financials are based on the most recent Mortgage that was taken out on this home.
Original Mortgage
$136,000
Outstanding Balance
$85,091
Interest Rate
4.91%
Mortgage Type
Purchase Money Mortgage
Estimated Equity
$292,667
Purchase Details
Closed on
May 7, 2004
Sold by
Perry Homes
Bought by
Duncan Greg M and Duncan Donna
Home Financials for this Owner
Home Financials are based on the most recent Mortgage that was taken out on this home.
Original Mortgage
$130,400
Interest Rate
4.5%
Mortgage Type
Purchase Money Mortgage
Create a Home Valuation Report for This Property
The Home Valuation Report is an in-depth analysis detailing your home's value as well as a comparison with similar homes in the area
Home Values in the Area
Average Home Value in this Area
Purchase History
| Date | Buyer | Sale Price | Title Company |
|---|---|---|---|
| Nguyen Hung Q | -- | First American Title | |
| Gmac Global Relocation Llc | -- | First American Title | |
| Duncan Greg M | -- | Chicago Title |
Source: Public Records
Mortgage History
| Date | Status | Borrower | Loan Amount |
|---|---|---|---|
| Open | Nguyen Hung Q | $136,000 | |
| Previous Owner | Duncan Greg M | $130,400 | |
| Closed | Duncan Greg M | $12,600 |
Source: Public Records
Tax History Compared to Growth
Tax History
| Year | Tax Paid | Tax Assessment Tax Assessment Total Assessment is a certain percentage of the fair market value that is determined by local assessors to be the total taxable value of land and additions on the property. | Land | Improvement |
|---|---|---|---|---|
| 2025 | $8,264 | $355,544 | $71,875 | $283,669 |
| 2024 | $8,264 | $372,127 | $68,971 | $303,156 |
| 2023 | $8,264 | $344,189 | $62,074 | $282,115 |
| 2022 | $7,499 | $317,137 | $62,074 | $255,063 |
| 2021 | $6,404 | $256,745 | $43,561 | $213,184 |
| 2020 | $6,192 | $256,781 | $43,561 | $213,220 |
| 2019 | $6,191 | $232,822 | $41,746 | $191,076 |
| 2018 | $2,827 | $211,000 | $44,856 | $166,144 |
| 2017 | $6,126 | $230,752 | $44,856 | $185,896 |
| 2016 | $6,126 | $230,752 | $44,856 | $185,896 |
| 2015 | $5,832 | $230,752 | $44,856 | $185,896 |
| 2014 | $5,832 | $214,869 | $44,856 | $170,013 |
Source: Public Records
Map
Nearby Homes
- 11510 Maple Falls Dr
- 11606 Gatesden Dr
- 15834 Arbor Lake Dr
- 11619 Buck Springs Trail
- 11607 Buck Springs Trail
- 15703 Downford Dr
- 15603 Canterbury Forest Dr
- 15627 Lago Villa Dr
- 15603 Lakewood Terrace Dr
- 11719 Lakewood Crossing Dr
- 11722 Gray Forest Trail
- 15522 Waldwick Dr
- 16102 Buckhead Ct
- 11802 Laurel Meadow Dr
- 11831 Gray Forest Trail
- 15614 Hatfield Hollow Dr
- 15915 Broad Oak Ct
- 15418 Waldwick Dr
- 16206 Lakewood Field Dr
- 15627 Gettysburg Dr
- 11523 Maple Falls Dr
- 11515 Maple Falls Dr
- 11527 Maple Falls Dr
- 11511 Maple Falls Dr
- 11506 Gatesden Dr
- 11518 Maple Falls Dr
- 11502 Gatesden Dr
- 11510 Maple Falls Dr
- 11522 Maple Falls Dr
- 11531 Maple Falls Dr
- 11510 Gatesden Dr
- 11507 Maple Falls Dr
- 15806 Arbor Lake Dr
- 11414 Gatesden Dr
- 11502 Maple Falls Dr
- 11502 Maple Falls Dr
- 11503 Maple Falls Dr
- 15810 Arbor Lake Dr
- 11507 Ridgewick Ct
- 11535 Maple Falls Dr