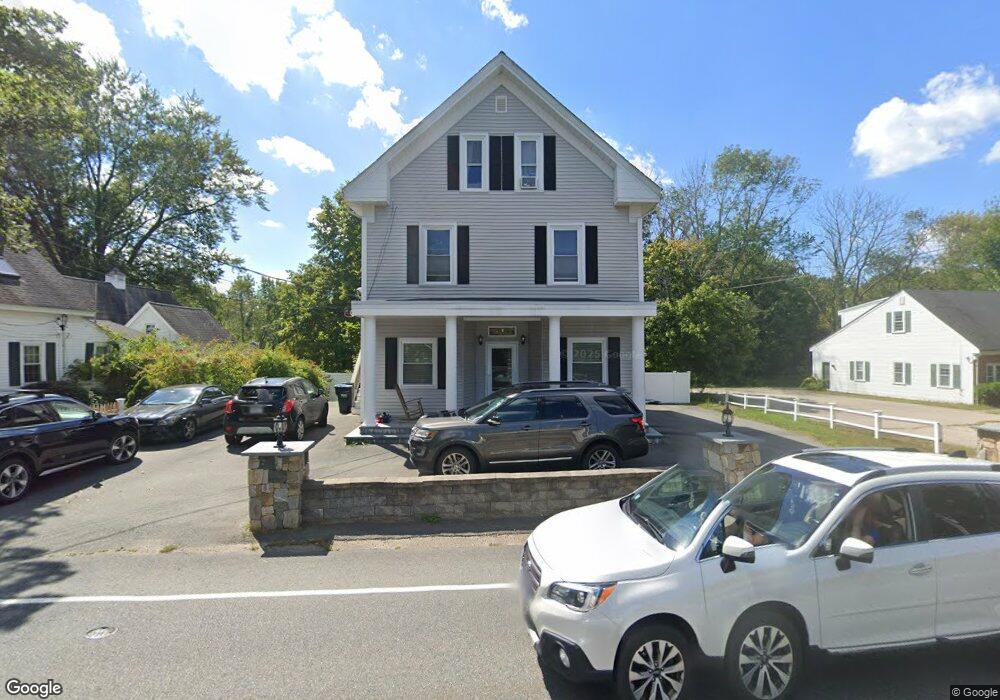
1152 Main St Hanover, MA 02339
Estimated Value: $893,000 - $1,928,000
7
Beds
4
Baths
3,494
Sq Ft
$348/Sq Ft
Est. Value
About This Home
This home is located at 1152 Main St, Hanover, MA 02339 and is currently estimated at $1,216,509, approximately $348 per square foot. 1152 Main St is a home located in Plymouth County with nearby schools including Hanover High School, South Shore Charter Public School, and Norwell KinderCare.
Ownership History
Date
Name
Owned For
Owner Type
Purchase Details
Closed on
Feb 1, 2010
Sold by
Weymouth Bk
Bought by
Marshall Michael J
Current Estimated Value
Home Financials for this Owner
Home Financials are based on the most recent Mortgage that was taken out on this home.
Original Mortgage
$356,000
Outstanding Balance
$234,667
Interest Rate
4.95%
Mortgage Type
Commercial
Estimated Equity
$981,842
Purchase Details
Closed on
Mar 23, 2009
Sold by
Stempel Richard
Bought by
Weymouth Bk
Create a Home Valuation Report for This Property
The Home Valuation Report is an in-depth analysis detailing your home's value as well as a comparison with similar homes in the area
Home Values in the Area
Average Home Value in this Area
Purchase History
| Date | Buyer | Sale Price | Title Company |
|---|---|---|---|
| Marshall Michael J | $460,000 | -- | |
| Weymouth Bk | $360,000 | -- |
Source: Public Records
Mortgage History
| Date | Status | Borrower | Loan Amount |
|---|---|---|---|
| Open | Marshall Michael J | $356,000 | |
| Previous Owner | Weymouth Bk | $65,000 |
Source: Public Records
Tax History
| Year | Tax Paid | Tax Assessment Tax Assessment Total Assessment is a certain percentage of the fair market value that is determined by local assessors to be the total taxable value of land and additions on the property. | Land | Improvement |
|---|---|---|---|---|
| 2025 | $8,446 | $683,900 | $280,200 | $403,700 |
| 2024 | $8,781 | $683,900 | $280,200 | $403,700 |
| 2023 | $8,615 | $638,600 | $254,700 | $383,900 |
| 2022 | $8,802 | $577,200 | $212,300 | $364,900 |
| 2021 | $269 | $557,800 | $193,000 | $364,800 |
| 2020 | $5,718 | $350,600 | $193,000 | $157,600 |
| 2019 | $5,753 | $350,600 | $193,000 | $157,600 |
| 2018 | $5,708 | $350,600 | $193,000 | $157,600 |
| 2017 | $5,790 | $350,500 | $192,400 | $158,100 |
| 2016 | $5,926 | $351,500 | $175,000 | $176,500 |
| 2015 | $5,934 | $367,400 | $190,900 | $176,500 |
Source: Public Records
Map
Nearby Homes
- 46 Brookwood Rd
- 535 Webster St
- 18 Winterberry Ln
- 49 Washington Park Dr
- 73 Shingle Mill Ln
- 776 Main St
- 44 Stone Meadow Ln
- 47 Stone Meadow Ln
- 738 Whiting St
- 7 Assinippi Ave Unit 205
- 7 Assinippi Ave Unit 306
- 214 Washington St Unit 24
- 214 Washington St Unit 28
- 53 Chestnut St
- 5 Blueberry Ct
- 36 Bayberry Ln
- 8 Blueberry Ct
- 18 Colby St
- 55 Turner Rd
- 506 Main St
Your Personal Tour Guide
Ask me questions while you tour the home.