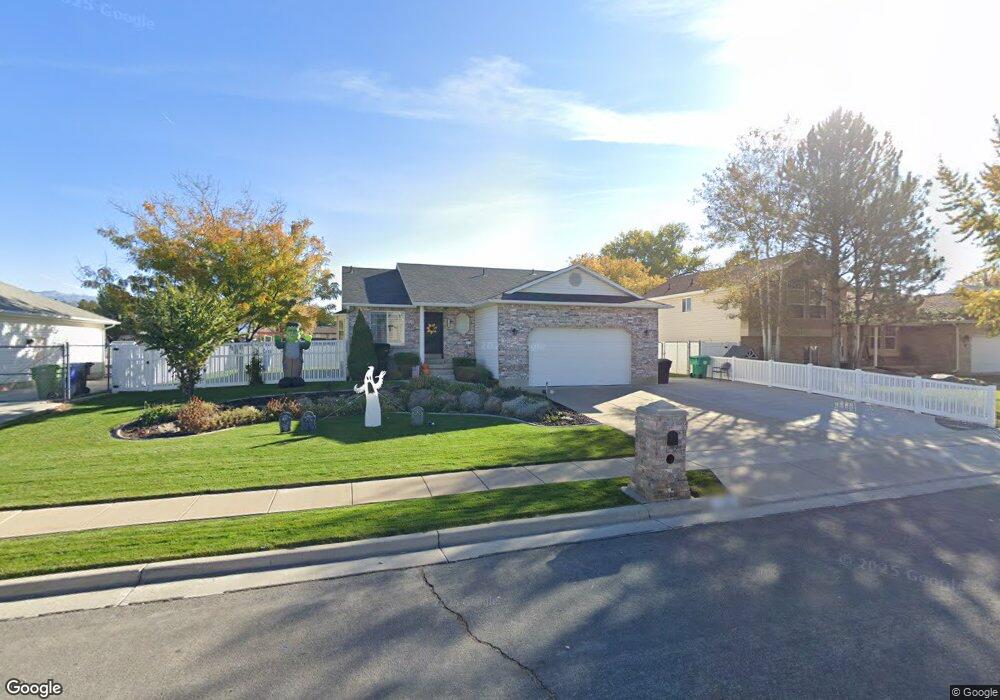
1152 N 3050 W Clearfield, UT 84015
Estimated Value: $470,000 - $535,000
4
Beds
3
Baths
2,560
Sq Ft
$196/Sq Ft
Est. Value
About This Home
This home is located at 1152 N 3050 W, Clearfield, UT 84015 and is currently estimated at $502,742, approximately $196 per square foot. 1152 N 3050 W is a home located in Davis County with nearby schools including Lakeside School, West Point Junior High School, and Syracuse High School.
Ownership History
Date
Name
Owned For
Owner Type
Purchase Details
Closed on
Jul 17, 2002
Sold by
Gifford Terrance M and Miller Carlotta D
Bought by
Gifford Terrance M and Gifford Carlotta D Miller
Current Estimated Value
Purchase Details
Closed on
Aug 25, 1999
Sold by
Manning Conn Jason and Manning Shawny K
Bought by
Gifford Terrance M and Miller Carlotta D
Home Financials for this Owner
Home Financials are based on the most recent Mortgage that was taken out on this home.
Original Mortgage
$129,631
Outstanding Balance
$36,990
Interest Rate
7.56%
Mortgage Type
FHA
Estimated Equity
$465,752
Purchase Details
Closed on
Nov 24, 1997
Sold by
Manning Conn and Manning Shawny K
Bought by
Manning Conn Jason and Manning Shawny K
Purchase Details
Closed on
Oct 23, 1997
Sold by
New Hampton Manor Associates
Bought by
Manning Conn and Manning Shawny K
Create a Home Valuation Report for This Property
The Home Valuation Report is an in-depth analysis detailing your home's value as well as a comparison with similar homes in the area
Home Values in the Area
Average Home Value in this Area
Purchase History
| Date | Buyer | Sale Price | Title Company |
|---|---|---|---|
| Gifford Terrance M | -- | Founders Title Co | |
| Gifford Terrance M | -- | First American Title Ins Co | |
| Manning Conn Jason | -- | Security Title Company | |
| Manning Conn | -- | Security Title Company |
Source: Public Records
Mortgage History
| Date | Status | Borrower | Loan Amount |
|---|---|---|---|
| Open | Gifford Terrance M | $129,631 |
Source: Public Records
Tax History Compared to Growth
Tax History
| Year | Tax Paid | Tax Assessment Tax Assessment Total Assessment is a certain percentage of the fair market value that is determined by local assessors to be the total taxable value of land and additions on the property. | Land | Improvement |
|---|---|---|---|---|
| 2025 | $2,811 | $263,450 | $102,005 | $161,445 |
| 2024 | $2,694 | $253,550 | $91,887 | $161,663 |
| 2023 | $2,489 | $431,000 | $111,366 | $319,634 |
| 2022 | $2,687 | $254,650 | $57,064 | $197,586 |
| 2021 | $2,461 | $349,000 | $92,551 | $256,449 |
| 2020 | $2,158 | $302,000 | $77,123 | $224,877 |
| 2019 | $2,073 | $286,000 | $75,011 | $210,989 |
| 2018 | $1,883 | $256,000 | $76,402 | $179,598 |
| 2016 | $1,648 | $117,920 | $29,500 | $88,420 |
| 2015 | $1,573 | $106,645 | $29,500 | $77,145 |
| 2014 | $1,491 | $102,545 | $29,500 | $73,045 |
| 2013 | -- | $81,062 | $25,850 | $55,212 |
Source: Public Records
Map
Nearby Homes