Estimated Value: $161,000 - $217,000
3
Beds
2
Baths
1,900
Sq Ft
$96/Sq Ft
Est. Value
About This Home
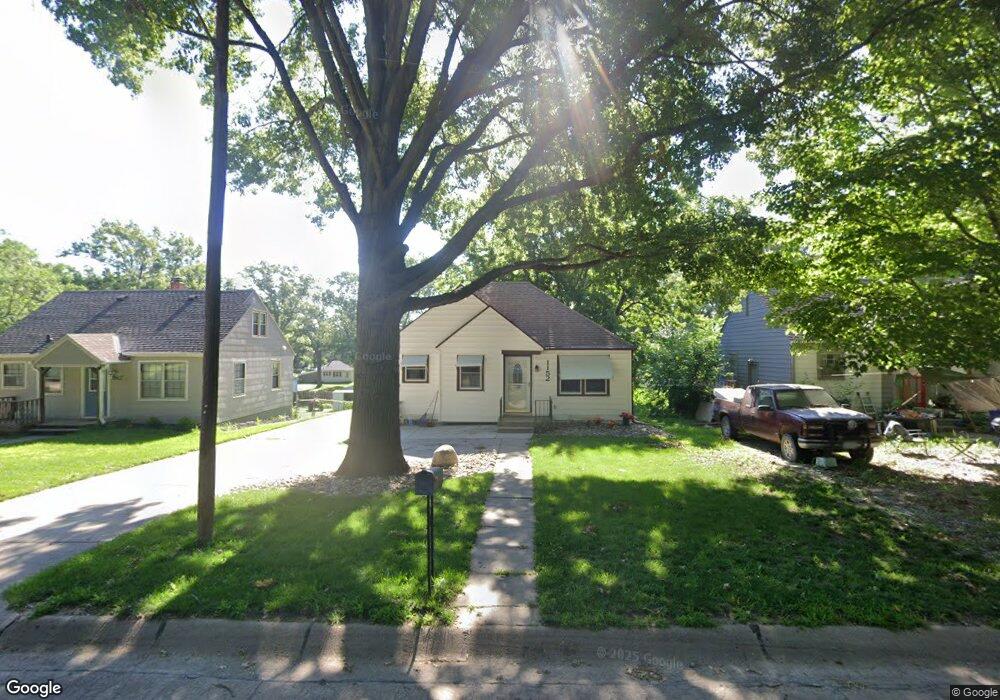
This home is located at 1152 N Sycamore St, Wahoo, NE 68066 and is currently estimated at $182,696, approximately $96 per square foot. 1152 N Sycamore St is a home located in Saunders County with nearby schools including Wahoo Elementary School, Wahoo Middle School, and Wahoo High School.
Create a Home Valuation Report for This Property
The Home Valuation Report is an in-depth analysis detailing your home's value as well as a comparison with similar homes in the area
Home Values in the Area
Average Home Value in this Area
Tax History Compared to Growth
Tax History
| Year | Tax Paid | Tax Assessment Tax Assessment Total Assessment is a certain percentage of the fair market value that is determined by local assessors to be the total taxable value of land and additions on the property. | Land | Improvement |
|---|---|---|---|---|
| 2024 | $1,624 | $120,373 | $17,409 | $102,964 |
| 2023 | $2,072 | $118,406 | $17,409 | $100,997 |
| 2022 | $1,677 | $89,430 | $17,409 | $72,021 |
| 2021 | $1,644 | $85,283 | $17,409 | $67,874 |
| 2020 | $1,612 | $83,072 | $17,409 | $65,663 |
| 2019 | $1,599 | $80,547 | $17,409 | $63,138 |
| 2018 | $1,661 | $80,160 | $17,410 | $62,750 |
| 2017 | $1,656 | $80,160 | $17,410 | $62,750 |
| 2016 | $1,637 | $78,050 | $17,410 | $60,640 |
| 2015 | $1,649 | $78,050 | $17,410 | $60,640 |
| 2014 | $1,678 | $78,050 | $17,410 | $60,640 |
| 2012 | $1,776 | $78,050 | $17,410 | $60,640 |
Source: Public Records
Map
Nearby Homes
- 1142 N Sycamore St
- 1132 N Sycamore St
- 1172 N Sycamore St
- 1141 Desnay Blvd
- 1155 Desnay Blvd
- 1169 Desnay Blvd
- 1185 Desnay Blvd
- 1106 N Sycamore St
- 440 W 11th St
- 1201 Desnay Blvd
- 1182 N Sycamore St
- 1133 Desnay Blvd
- 1215 Desnay Blvd
- 1159 N Sycamore St
- 1113 Desnay Blvd
- 1173 N Sycamore St
- 1179 N Sycamore St
- 1192 N Sycamore St
- 1127 N Sycamore St
- 1150 Desnay Blvd