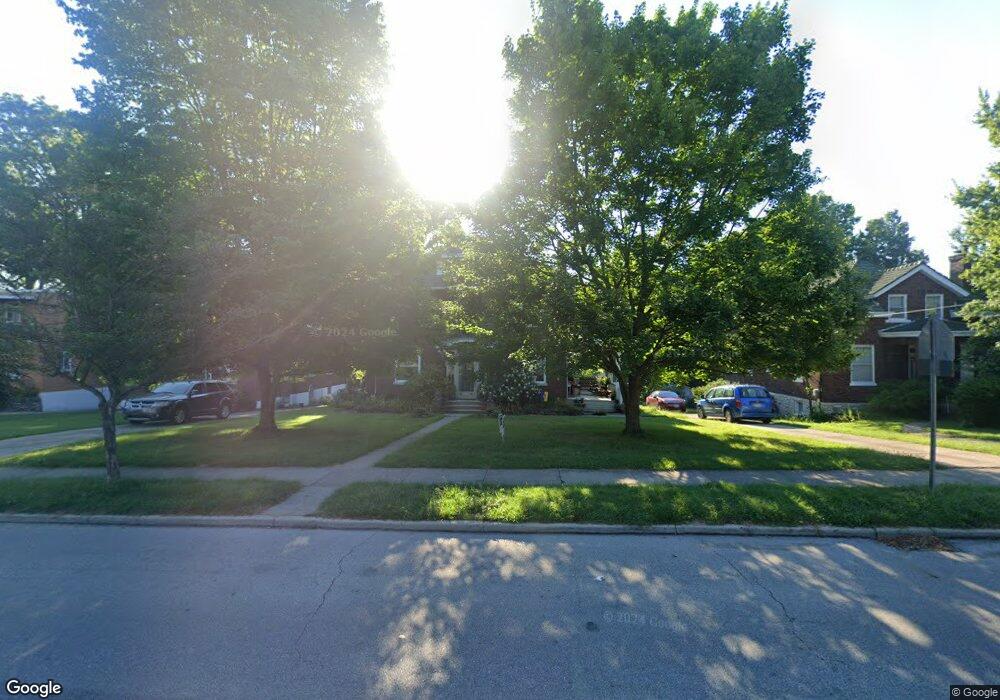
1152 Overlook Ave Cincinnati, OH 45238
West Price Hill NeighborhoodEstimated Value: $258,000 - $281,000
4
Beds
2
Baths
1,942
Sq Ft
$136/Sq Ft
Est. Value
About This Home
This home is located at 1152 Overlook Ave, Cincinnati, OH 45238 and is currently estimated at $264,958, approximately $136 per square foot. 1152 Overlook Ave is a home located in Hamilton County with nearby schools including Carson School, Gilbert A. Dater High School, and Western Hills High School.
Ownership History
Date
Name
Owned For
Owner Type
Purchase Details
Closed on
Jun 6, 2003
Sold by
Leonardi Antonio and Leonardi Antonio R
Bought by
Tonnis James B and Gomien Tonnis Joan P
Current Estimated Value
Home Financials for this Owner
Home Financials are based on the most recent Mortgage that was taken out on this home.
Original Mortgage
$107,500
Outstanding Balance
$47,090
Interest Rate
5.78%
Mortgage Type
Unknown
Estimated Equity
$217,868
Purchase Details
Closed on
Jun 24, 1996
Sold by
Leonardi Antonio R
Bought by
Leonardi Antonio R and Leonardi Ines
Home Financials for this Owner
Home Financials are based on the most recent Mortgage that was taken out on this home.
Original Mortgage
$91,000
Interest Rate
8.31%
Create a Home Valuation Report for This Property
The Home Valuation Report is an in-depth analysis detailing your home's value as well as a comparison with similar homes in the area
Home Values in the Area
Average Home Value in this Area
Purchase History
| Date | Buyer | Sale Price | Title Company |
|---|---|---|---|
| Tonnis James B | $137,500 | Advanced Land Title Agency L | |
| Leonardi Antonio R | -- | -- |
Source: Public Records
Mortgage History
| Date | Status | Borrower | Loan Amount |
|---|---|---|---|
| Open | Tonnis James B | $107,500 | |
| Previous Owner | Leonardi Antonio R | $91,000 |
Source: Public Records
Tax History Compared to Growth
Tax History
| Year | Tax Paid | Tax Assessment Tax Assessment Total Assessment is a certain percentage of the fair market value that is determined by local assessors to be the total taxable value of land and additions on the property. | Land | Improvement |
|---|---|---|---|---|
| 2024 | $3,947 | $65,723 | $8,267 | $57,456 |
| 2023 | $4,033 | $65,723 | $8,267 | $57,456 |
| 2022 | $2,284 | $33,212 | $8,215 | $24,997 |
| 2021 | $2,195 | $33,212 | $8,215 | $24,997 |
| 2020 | $2,256 | $33,212 | $8,215 | $24,997 |
| 2019 | $2,243 | $30,195 | $7,469 | $22,726 |
| 2018 | $2,247 | $30,195 | $7,469 | $22,726 |
| 2017 | $2,135 | $30,195 | $7,469 | $22,726 |
| 2016 | $2,503 | $34,965 | $7,980 | $26,985 |
| 2015 | $2,257 | $34,965 | $7,980 | $26,985 |
| 2014 | $2,273 | $34,965 | $7,980 | $26,985 |
| 2013 | $2,624 | $39,733 | $9,069 | $30,664 |
Source: Public Records
Map
Nearby Homes
- 1131 Olivia Ln
- 4762 Highridge Ave
- 4764 Dale Ave
- 4779 Dale Ave
- 4813 Rapid Run Rd
- 1022 Benz Ave
- 4934 Relleum Ave
- 4965 Glenway Ave
- 4638 Glenway Ave
- 1195 Nancy Lee Ln
- 4553 Clearview Ave
- 4549 Clearview Ave
- 816 Pedretti Ave
- 815 Pedretti Ave
- 4526 Clearview Ave
- 5009 Relleum Ave
- 4885 N Overlook Ave
- 4419 Ridgeview Ave
- 1020 Seibel Ln
- 990 Covedale Ave
- 1156 Overlook Ave
- 1148 Overlook Ave
- 1160 Overlook Ave
- 1146 Overlook Ave
- 1164 Overlook Ave
- 1168 Overlook Ave
- 1157 Overlook Ave
- 1151 Overlook Ave
- 1147 Overlook Ave
- 1143 Overlook Ave
- 1132 Overlook Ave
- 1172 Overlook Ave
- 1165 Overlook Ave
- 1169 Overlook Ave
- 1139 Overlook Ave
- 1176 Overlook Ave
- 1141 Olivia Ln
- 1145 Olivia Ln
- 1137 Olivia Ln
- 1128 Overlook Ave