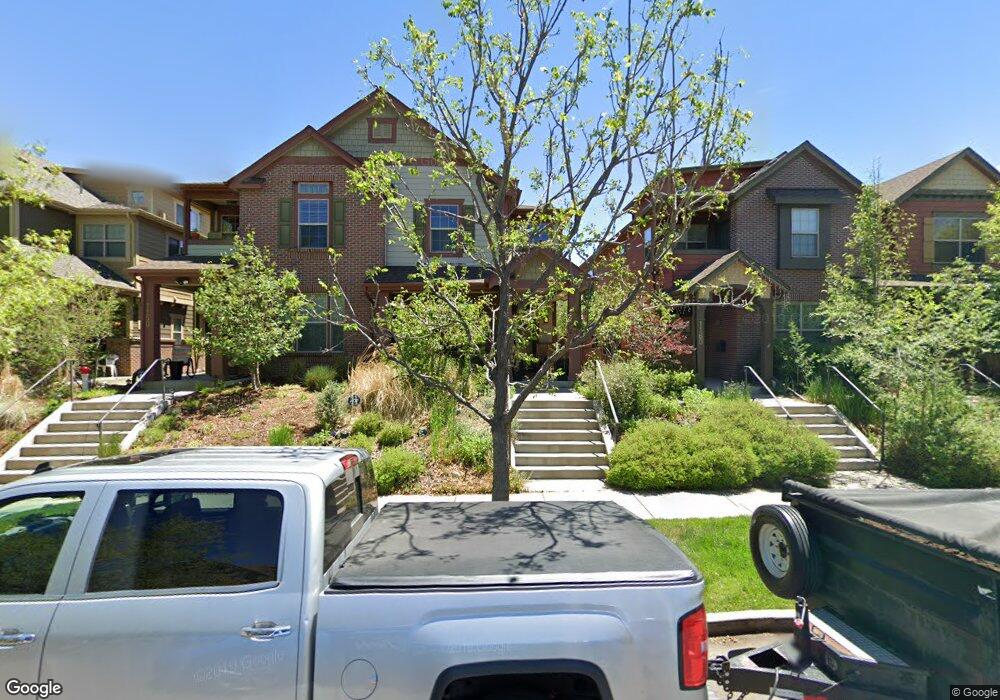
1152 S Grant St Denver, CO 80210
Platt Park NeighborhoodEstimated Value: $1,005,000 - $1,201,000
3
Beds
4
Baths
2,068
Sq Ft
$512/Sq Ft
Est. Value
About This Home
This home is located at 1152 S Grant St, Denver, CO 80210 and is currently estimated at $1,059,578, approximately $512 per square foot. 1152 S Grant St is a home located in Denver County with nearby schools including McKinley-Thatcher Elementary School, Grant Beacon Middle School, and South High School.
Ownership History
Date
Name
Owned For
Owner Type
Purchase Details
Closed on
Mar 3, 2010
Sold by
Horton Carrie M
Bought by
Horton William J
Current Estimated Value
Home Financials for this Owner
Home Financials are based on the most recent Mortgage that was taken out on this home.
Original Mortgage
$417,000
Outstanding Balance
$276,241
Interest Rate
4.97%
Mortgage Type
New Conventional
Estimated Equity
$783,337
Purchase Details
Closed on
Apr 4, 2007
Sold by
Mcstain Enterprises Inc
Bought by
Horton Carrie M and Horton William J
Home Financials for this Owner
Home Financials are based on the most recent Mortgage that was taken out on this home.
Original Mortgage
$417,000
Interest Rate
6.19%
Mortgage Type
Purchase Money Mortgage
Purchase Details
Closed on
Nov 28, 2005
Sold by
Murray Hugh W
Bought by
Mcstain Enterprises Inc
Purchase Details
Closed on
Oct 15, 1999
Sold by
Murray Tess D
Bought by
Murray Tess D
Create a Home Valuation Report for This Property
The Home Valuation Report is an in-depth analysis detailing your home's value as well as a comparison with similar homes in the area
Home Values in the Area
Average Home Value in this Area
Purchase History
| Date | Buyer | Sale Price | Title Company |
|---|---|---|---|
| Horton William J | -- | None Available | |
| Horton Carrie M | $530,385 | Land Title Guarantee Company | |
| Mcstain Enterprises Inc | $200,000 | -- | |
| Murray Tess D | -- | -- | |
| Murray Tess D | -- | -- |
Source: Public Records
Mortgage History
| Date | Status | Borrower | Loan Amount |
|---|---|---|---|
| Open | Horton William J | $417,000 | |
| Closed | Horton Carrie M | $417,000 |
Source: Public Records
Tax History Compared to Growth
Tax History
| Year | Tax Paid | Tax Assessment Tax Assessment Total Assessment is a certain percentage of the fair market value that is determined by local assessors to be the total taxable value of land and additions on the property. | Land | Improvement |
|---|---|---|---|---|
| 2024 | $5,459 | $68,920 | $12,450 | $56,470 |
| 2023 | $5,340 | $68,920 | $12,450 | $56,470 |
| 2022 | $4,251 | $53,450 | $16,740 | $36,710 |
| 2021 | $4,103 | $54,990 | $17,220 | $37,770 |
| 2020 | $3,820 | $51,480 | $13,990 | $37,490 |
| 2019 | $3,713 | $51,480 | $13,990 | $37,490 |
| 2018 | $3,512 | $45,390 | $14,090 | $31,300 |
| 2017 | $3,501 | $45,390 | $14,090 | $31,300 |
| 2016 | $3,876 | $47,530 | $17,974 | $29,556 |
Source: Public Records
Map
Nearby Homes
- 1056 S Pennsylvania St
- 1001 S Pennsylvania St Unit 1005
- 1209 S Pennsylvania St
- 969 S Pearl St Unit 204
- 857 S Grant St
- 1355 S Pennsylvania St
- 838 S Sherman St
- 1023 S Emerson St
- 981 S Emerson St
- 130 E Ohio Ave Unit 140
- 1313 S Clarkson St Unit 305
- 1313 S Clarkson St Unit 405
- 1313 S Clarkson St Unit 202
- 1144 S Cherokee St
- 1127 S Ogden St
- 1260 S Emerson St
- 794 S Pearl St
- 1050 S Corona St
- 1518 S Sherman St
- 646 S Lincoln St
- 1152 S Grant St
- 1150 S Grant St
- 1142 S Grant St
- 1166 S Grant St
- 1160 S Grant St
- 1140 S Grant St
- 1140 S Grant St
- 1162 S Grant St
- 1172 S Grant St
- 1146 S Grant St
- 1132 S Grant St
- 1178 S Grant St
- 1130 S Grant St
- 1126 S Grant St
- 1157 S Grant St
- 1155 S Grant St
- 1155 S Grant St
- 1157 S Logan St
- 1165 S Grant St
- 1165 S Grant St