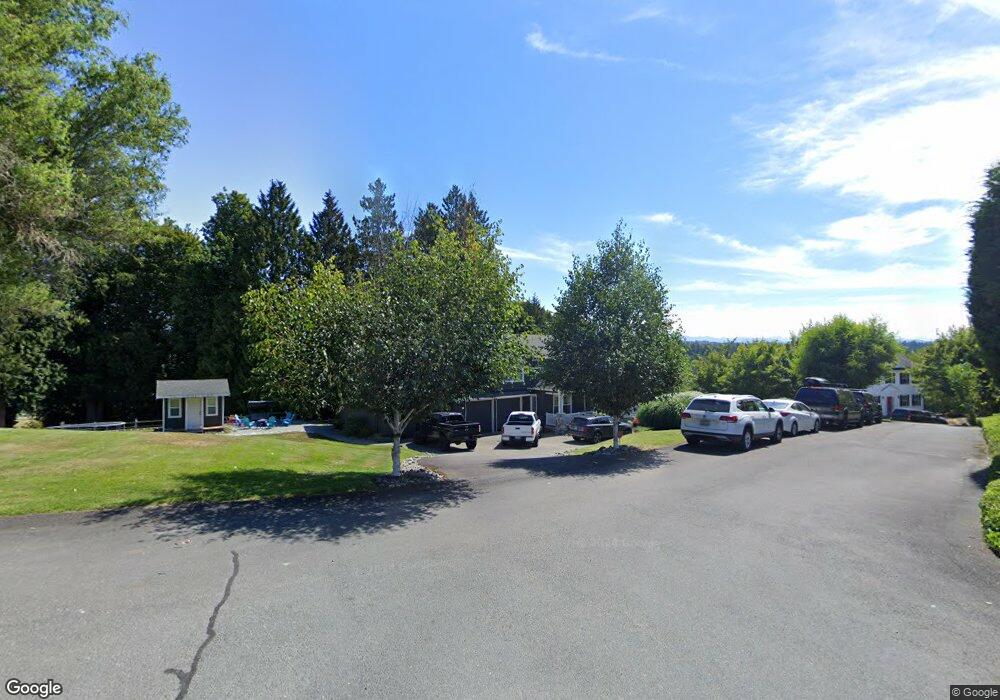
11520 42nd Place SE Snohomish, WA 98290
Bunk Foss NeighborhoodEstimated Value: $1,195,000 - $1,243,000
4
Beds
3
Baths
3,000
Sq Ft
$406/Sq Ft
Est. Value
About This Home
This home is located at 11520 42nd Place SE, Snohomish, WA 98290 and is currently estimated at $1,217,187, approximately $405 per square foot. 11520 42nd Place SE is a home located in Snohomish County with nearby schools including Cascade View Elementary School, Centennial Middle School, and Snohomish High School.
Ownership History
Date
Name
Owned For
Owner Type
Purchase Details
Closed on
May 30, 2003
Sold by
Sparacio Thomas and Sparacio Rozaine
Bought by
Mcneill John and Mcneill Tanya
Current Estimated Value
Home Financials for this Owner
Home Financials are based on the most recent Mortgage that was taken out on this home.
Original Mortgage
$101,250
Interest Rate
5.5%
Mortgage Type
Balloon
Purchase Details
Closed on
Feb 11, 2002
Sold by
Garrison Patrick J and Garrison Charlotte L
Bought by
Wales John and Wales Misty
Home Financials for this Owner
Home Financials are based on the most recent Mortgage that was taken out on this home.
Original Mortgage
$287,600
Interest Rate
6.75%
Purchase Details
Closed on
Sep 10, 1999
Sold by
Boyden Robinett & Associates Lp
Bought by
Garrison Patrick J and Garrison Charlotte L
Home Financials for this Owner
Home Financials are based on the most recent Mortgage that was taken out on this home.
Original Mortgage
$276,500
Interest Rate
8.12%
Create a Home Valuation Report for This Property
The Home Valuation Report is an in-depth analysis detailing your home's value as well as a comparison with similar homes in the area
Home Values in the Area
Average Home Value in this Area
Purchase History
| Date | Buyer | Sale Price | Title Company |
|---|---|---|---|
| Mcneill John | $135,000 | Stewart Title Company | |
| Wales John | $359,500 | -- | |
| Garrison Patrick J | $97,500 | -- |
Source: Public Records
Mortgage History
| Date | Status | Borrower | Loan Amount |
|---|---|---|---|
| Closed | Mcneill John | $101,250 | |
| Previous Owner | Wales John | $287,600 | |
| Previous Owner | Garrison Patrick J | $276,500 | |
| Closed | Wales John | $71,900 |
Source: Public Records
Tax History Compared to Growth
Tax History
| Year | Tax Paid | Tax Assessment Tax Assessment Total Assessment is a certain percentage of the fair market value that is determined by local assessors to be the total taxable value of land and additions on the property. | Land | Improvement |
|---|---|---|---|---|
| 2025 | $9,813 | $1,042,200 | $500,300 | $541,900 |
| 2024 | $9,813 | $966,100 | $442,300 | $523,800 |
| 2023 | $9,233 | $1,010,000 | $474,300 | $535,700 |
| 2022 | $8,413 | $744,400 | $312,300 | $432,100 |
| 2020 | $7,919 | $651,000 | $273,300 | $377,700 |
| 2019 | $7,109 | $595,300 | $238,300 | $357,000 |
| 2018 | $7,476 | $525,200 | $190,300 | $334,900 |
| 2017 | $6,786 | $482,400 | $167,300 | $315,100 |
| 2016 | $6,637 | $456,600 | $150,600 | $306,000 |
| 2015 | $6,750 | $444,500 | $132,000 | $312,500 |
| 2013 | $5,867 | $370,300 | $95,000 | $275,300 |
Source: Public Records
Map
Nearby Homes
- 4511 109th Ave SE
- 3129 115th Ave SE
- 10419 46th Place SE
- 2803 121st Ave SE
- 4931 125th Ave SE
- 9929 40th Place SE
- 2327 122nd Dr SE
- 2221 119th Dr SE
- 2207 115th Dr SE
- 10406 26th Place SE
- 3431 97th Dr SE
- 12104 22nd St SE
- 12004 22nd St SE
- 10224 25th Place SE
- 10310 25th St SE
- 10109 56th St SE
- 2415 103rd Dr SE
- 11629 20th St SE
- 12121 21st St SE
- 12027 21st St SE
- 11516 42nd Place SE
- 11521 42nd Place SE
- 11512 42nd Place SE
- 3933 115th Ave SE
- 4111 115th Ave SE
- 4015 115th Ave SE
- 4007 115th Ave SE
- 3931 115th Ave SE
- 4221 116th Dr SE
- 3927 115th Ave SE
- 4203 115th Ave SE
- 11410 42nd St SE
- 11407 42nd St SE
- 11406 42nd St SE
- 4211 115th Ave SE
- 3921 115th Ave SE
- 4208 115th Ave SE
- 4006 115th Ave SE
- 4225 115th Ave SE
- 3928 115th Ave SE