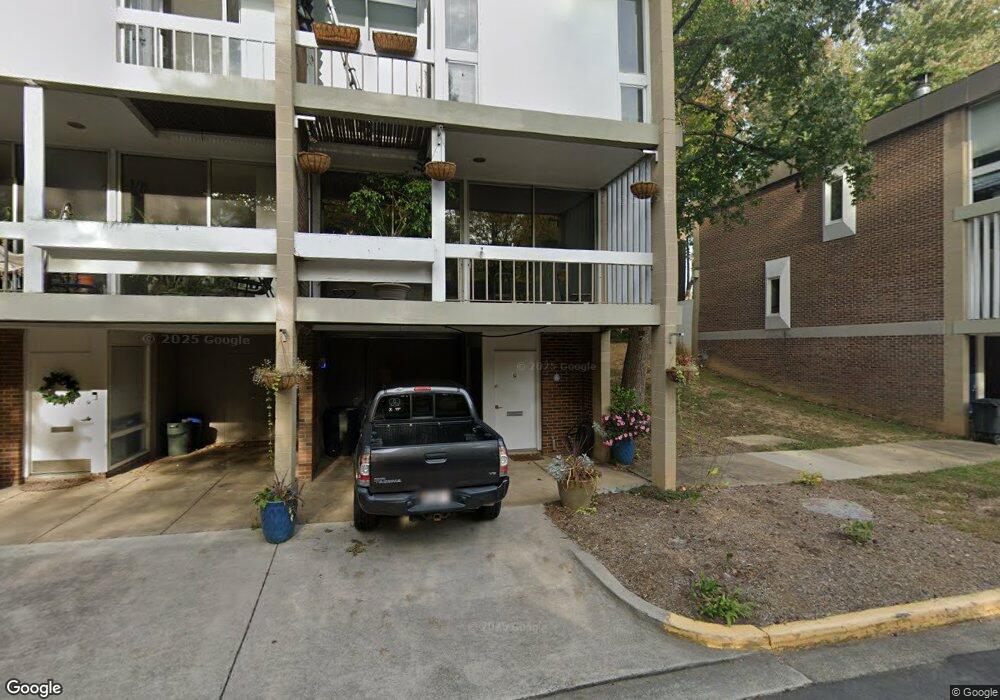
11520 Maple Ridge Rd Reston, VA 20190
Lake Anne NeighborhoodEstimated Value: $564,000 - $619,000
3
Beds
2
Baths
1,264
Sq Ft
$461/Sq Ft
Est. Value
About This Home
This home is located at 11520 Maple Ridge Rd, Reston, VA 20190 and is currently estimated at $582,075, approximately $460 per square foot. 11520 Maple Ridge Rd is a home located in Fairfax County with nearby schools including Lake Anne Elementary, Langston Hughes Middle School, and South Lakes High School.
Ownership History
Date
Name
Owned For
Owner Type
Purchase Details
Closed on
Feb 23, 2005
Sold by
Kay Bruce
Bought by
Lundberg Eric J
Current Estimated Value
Home Financials for this Owner
Home Financials are based on the most recent Mortgage that was taken out on this home.
Original Mortgage
$319,950
Outstanding Balance
$162,412
Interest Rate
5.73%
Mortgage Type
New Conventional
Estimated Equity
$419,663
Purchase Details
Closed on
Aug 23, 2001
Sold by
Marshall Jim E
Bought by
Kay Bruce
Purchase Details
Closed on
Nov 25, 1996
Sold by
Reston Land Corp
Bought by
Gulick Group Inc
Purchase Details
Closed on
Aug 31, 1995
Sold by
Gems Barbara L
Bought by
Kalinowski Maile E
Home Financials for this Owner
Home Financials are based on the most recent Mortgage that was taken out on this home.
Original Mortgage
$153,000
Interest Rate
7.61%
Create a Home Valuation Report for This Property
The Home Valuation Report is an in-depth analysis detailing your home's value as well as a comparison with similar homes in the area
Home Values in the Area
Average Home Value in this Area
Purchase History
| Date | Buyer | Sale Price | Title Company |
|---|---|---|---|
| Lundberg Eric J | $399,990 | -- | |
| Kay Bruce | $161,000 | -- | |
| Gulick Group Inc | $100,000 | -- | |
| Kalinowski Maile E | $150,000 | -- |
Source: Public Records
Mortgage History
| Date | Status | Borrower | Loan Amount |
|---|---|---|---|
| Open | Lundberg Eric J | $319,950 | |
| Previous Owner | Kalinowski Maile E | $153,000 |
Source: Public Records
Tax History
| Year | Tax Paid | Tax Assessment Tax Assessment Total Assessment is a certain percentage of the fair market value that is determined by local assessors to be the total taxable value of land and additions on the property. | Land | Improvement |
|---|---|---|---|---|
| 2025 | $6,336 | $560,140 | $160,000 | $400,140 |
| 2024 | $6,336 | $525,580 | $155,000 | $370,580 |
| 2023 | $6,078 | $517,090 | $155,000 | $362,090 |
| 2022 | $6,029 | $506,410 | $140,000 | $366,410 |
| 2021 | $5,392 | $441,800 | $130,000 | $311,800 |
| 2020 | $5,238 | $425,690 | $120,000 | $305,690 |
| 2019 | $5,048 | $410,220 | $120,000 | $290,220 |
| 2018 | $4,484 | $389,890 | $115,000 | $274,890 |
| 2017 | $4,705 | $389,480 | $115,000 | $274,480 |
| 2016 | $4,530 | $375,750 | $115,000 | $260,750 |
| 2015 | $4,370 | $375,750 | $115,000 | $260,750 |
| 2014 | $4,204 | $362,290 | $110,000 | $252,290 |
Source: Public Records
Map
Nearby Homes
- 11526 Maple Ridge Rd
- 11587 Maple Ridge Rd
- 1624 Fellowship Square
- 11604 Vantage Hill Rd Unit 12B
- 11606 Vantage Hill Rd Unit 12B
- 11611 Vantage Hill Rd Unit 11B
- 11400 Washington Plaza W Unit 1303
- 11514 Sunder Ct
- 11663 Vantage Hill Rd
- 11503 Waterhaven Ct
- 11477 Waterhaven Ct
- 1644 Wainwright Dr
- 11574 Lake Newport Rd
- 11500 Fairway Dr Unit 507
- 11611 Clubhouse Ct
- 1532 Northgate Square Unit 12A
- 1536 Northgate Square Unit 21
- 1540 Northgate Square Unit 21B
- 1781 Wainwright Dr
- 1575 Bennington Woods Ct
- 11522 Maple Ridge Rd
- 11514 Maple Ridge Rd
- 11512 Maple Ridge Rd
- 11510 Maple Ridge Rd
- 11508 Maple Ridge Rd
- 11506 Maple Ridge Rd
- 11527 Maple Ridge Rd
- 11504 Maple Ridge Rd
- 11525 Maple Ridge Rd
- 11502 Maple Ridge Rd
- 11523 Maple Ridge Rd
- 11500 Maple Ridge Rd
- 11515 Maple Ridge Rd
- 11513 Maple Ridge Rd
- 11501 Maple Ridge Rd
- 11517 Maple Ridge Rd
- 11503 Maple Ridge Rd
- 11521 Maple Ridge Rd
- 11511 Maple Ridge Rd
- 11509 Maple Ridge Rd
Your Personal Tour Guide
Ask me questions while you tour the home.