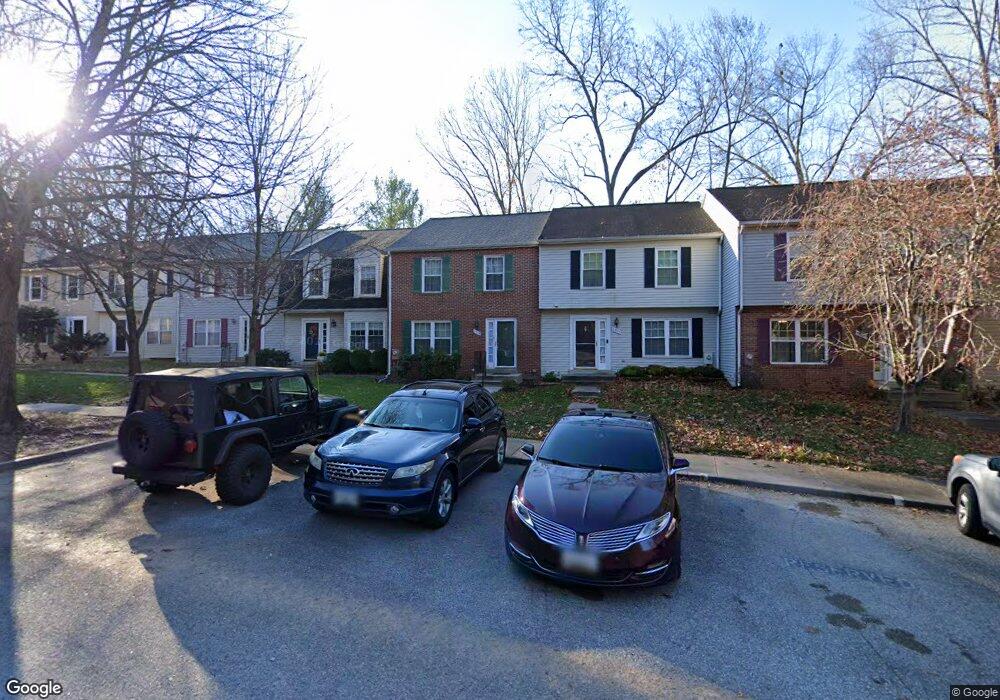
11525 Little Patuxent Pkwy Columbia, MD 21044
Hickory Ridge NeighborhoodEstimated Value: $439,000 - $449,541
--
Bed
4
Baths
1,496
Sq Ft
$296/Sq Ft
Est. Value
About This Home
This home is located at 11525 Little Patuxent Pkwy, Columbia, MD 21044 and is currently estimated at $442,885, approximately $296 per square foot. 11525 Little Patuxent Pkwy is a home located in Howard County with nearby schools including Clemens Crossing Elementary School, Harpers Choice Middle School, and Wilde Lake High.
Ownership History
Date
Name
Owned For
Owner Type
Purchase Details
Closed on
Jan 8, 2008
Sold by
Jones Karen
Bought by
Prempeh Michael A
Current Estimated Value
Home Financials for this Owner
Home Financials are based on the most recent Mortgage that was taken out on this home.
Original Mortgage
$245,600
Outstanding Balance
$155,914
Interest Rate
6.27%
Mortgage Type
Purchase Money Mortgage
Estimated Equity
$286,971
Purchase Details
Closed on
Dec 18, 2007
Sold by
Jones Karen
Bought by
Prempeh Michael A
Home Financials for this Owner
Home Financials are based on the most recent Mortgage that was taken out on this home.
Original Mortgage
$245,600
Outstanding Balance
$155,914
Interest Rate
6.27%
Mortgage Type
Purchase Money Mortgage
Estimated Equity
$286,971
Purchase Details
Closed on
Jan 29, 2003
Sold by
Olson Bradley J
Bought by
Jones Karen and Ashton Darrell
Purchase Details
Closed on
Dec 27, 2000
Sold by
Peddicord Edward S
Bought by
Olson Bradley J and Olson Sheri A
Create a Home Valuation Report for This Property
The Home Valuation Report is an in-depth analysis detailing your home's value as well as a comparison with similar homes in the area
Home Values in the Area
Average Home Value in this Area
Purchase History
| Date | Buyer | Sale Price | Title Company |
|---|---|---|---|
| Prempeh Michael A | $332,000 | -- | |
| Prempeh Michael A | $332,000 | -- | |
| Jones Karen | $191,600 | -- | |
| Olson Bradley J | $147,000 | -- |
Source: Public Records
Mortgage History
| Date | Status | Borrower | Loan Amount |
|---|---|---|---|
| Open | Prempeh Michael A | $245,600 | |
| Closed | Prempeh Michael A | $245,600 | |
| Closed | Olson Bradley J | -- |
Source: Public Records
Tax History Compared to Growth
Tax History
| Year | Tax Paid | Tax Assessment Tax Assessment Total Assessment is a certain percentage of the fair market value that is determined by local assessors to be the total taxable value of land and additions on the property. | Land | Improvement |
|---|---|---|---|---|
| 2025 | $5,368 | $363,600 | $0 | $0 |
| 2024 | $5,368 | $343,600 | $155,000 | $188,600 |
| 2023 | $5,108 | $329,067 | $0 | $0 |
| 2022 | $4,860 | $314,533 | $0 | $0 |
| 2021 | $4,493 | $300,000 | $120,000 | $180,000 |
| 2020 | $4,493 | $289,000 | $0 | $0 |
| 2019 | $4,335 | $278,000 | $0 | $0 |
| 2018 | $3,930 | $267,000 | $89,200 | $177,800 |
| 2017 | $3,871 | $267,000 | $0 | $0 |
| 2016 | $874 | $260,467 | $0 | $0 |
| 2015 | $874 | $257,200 | $0 | $0 |
| 2014 | $865 | $254,500 | $0 | $0 |
Source: Public Records
Map
Nearby Homes
- 11421 Little Patuxent Pkwy Unit 306
- 5964 Watch Chain Way
- 6009 Wild Ginger Ct
- 5920 Watch Chain Way
- 11796 Lone Tree Ct
- 11630 Sun Circle Way
- 11705 Lone Tree Ct
- 11754 Stonegate Ln
- 11238 Crystal Run Unit A
- 11789 Stonegate Ln
- 10958 Swansfield Rd
- 10968 Swansfield Rd
- 6365 Bright Plume
- 10637 High Beam Ct
- 10522 E Wind Way
- 5412 Bucksaw Ct
- 5472 Cedar Ln Unit A4
- 7679 Cross Creek Dr
- 11129 Wood Elves Way
- 5475 El Camino
- 11527 Little Patuxent Pkwy
- 11523 Little Patuxent Pkwy
- 11529 Little Patuxent Pkwy
- 11521 Little Patuxent Pkwy
- 11519 Little Patuxent Pkwy
- 11531 Little Patuxent Pkwy
- 11517 Little Patuxent Pkwy
- 11513 Little Patuxent Pkwy
- 11511 Little Patuxent Pkwy
- 11509 Little Patuxent Pkwy
- 11507 Little Patuxent Pkwy
- 11515 Shell Flower Ln
- 11505 Little Patuxent Pkwy
- 11501 Shell Flower Ln
- 11503 Shell Flower Ln
- 11505 Shell Flower Ln
- 11507 Shell Flower Ln
- 11517 Shell Flower Ln
- 11503 Little Patuxent Pkwy
- 11509 Shell Flower Ln