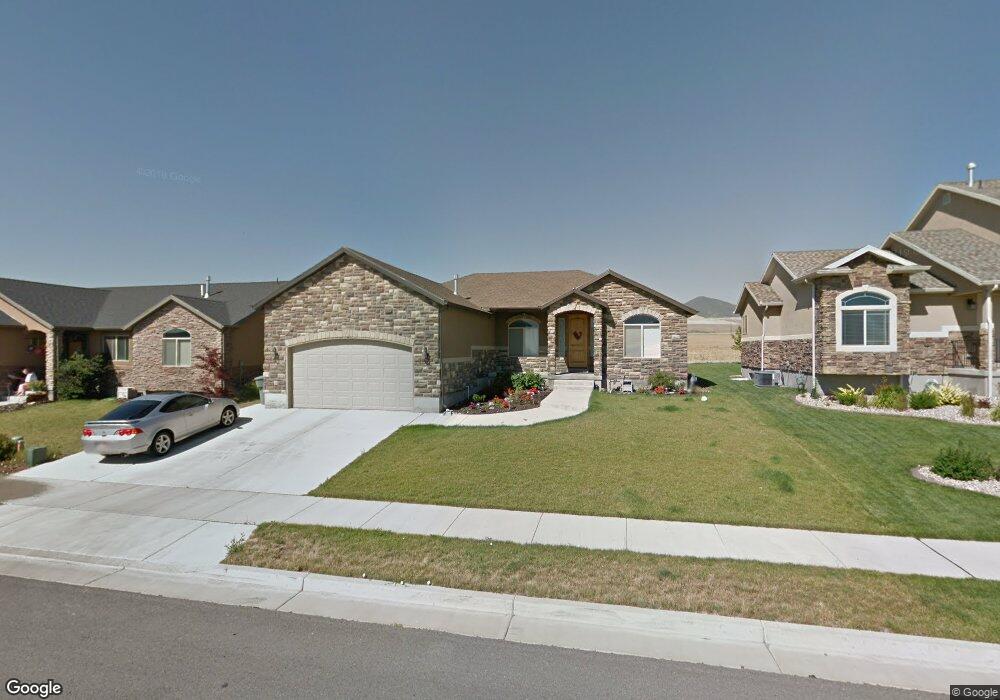
11526 Keystone Dr South Jordan, UT 84095
Daybreak NeighborhoodEstimated Value: $583,000 - $680,000
3
Beds
2
Baths
1,479
Sq Ft
$425/Sq Ft
Est. Value
About This Home
This home is located at 11526 Keystone Dr, South Jordan, UT 84095 and is currently estimated at $628,095, approximately $424 per square foot. 11526 Keystone Dr is a home located in Salt Lake County with nearby schools including Mountain Creek Middle School, Herriman High School, and Advantage Arts Academy.
Ownership History
Date
Name
Owned For
Owner Type
Purchase Details
Closed on
May 28, 2020
Sold by
Dent Penny F
Bought by
Dent Penny
Current Estimated Value
Home Financials for this Owner
Home Financials are based on the most recent Mortgage that was taken out on this home.
Original Mortgage
$221,800
Outstanding Balance
$196,975
Interest Rate
3.3%
Mortgage Type
New Conventional
Estimated Equity
$431,120
Purchase Details
Closed on
May 30, 2007
Sold by
Dent Christopher L
Bought by
Dent Penny F
Home Financials for this Owner
Home Financials are based on the most recent Mortgage that was taken out on this home.
Original Mortgage
$289,600
Interest Rate
6.12%
Mortgage Type
Purchase Money Mortgage
Purchase Details
Closed on
Oct 2, 2006
Sold by
Sunstone Village Iv Llc
Bought by
Dent Christopher L
Home Financials for this Owner
Home Financials are based on the most recent Mortgage that was taken out on this home.
Original Mortgage
$283,300
Interest Rate
6.43%
Mortgage Type
Construction
Create a Home Valuation Report for This Property
The Home Valuation Report is an in-depth analysis detailing your home's value as well as a comparison with similar homes in the area
Home Values in the Area
Average Home Value in this Area
Purchase History
| Date | Buyer | Sale Price | Title Company |
|---|---|---|---|
| Dent Penny | -- | Meridian Title | |
| Dent Penny F | -- | Executive Title Ins Agency | |
| Dent Christopher L | -- | Integrated Title Ins Service |
Source: Public Records
Mortgage History
| Date | Status | Borrower | Loan Amount |
|---|---|---|---|
| Open | Dent Penny | $221,800 | |
| Closed | Dent Penny F | $289,600 | |
| Previous Owner | Dent Christopher L | $283,300 |
Source: Public Records
Tax History Compared to Growth
Tax History
| Year | Tax Paid | Tax Assessment Tax Assessment Total Assessment is a certain percentage of the fair market value that is determined by local assessors to be the total taxable value of land and additions on the property. | Land | Improvement |
|---|---|---|---|---|
| 2025 | $2,815 | $549,400 | $163,500 | $385,900 |
| 2024 | $2,815 | $534,400 | $158,600 | $375,800 |
| 2023 | $2,896 | $518,800 | $154,000 | $364,800 |
| 2022 | $3,011 | $528,600 | $151,000 | $377,600 |
| 2021 | $2,491 | $401,300 | $115,700 | $285,600 |
| 2020 | $2,330 | $351,900 | $115,700 | $236,200 |
| 2019 | $2,296 | $340,800 | $109,100 | $231,700 |
| 2018 | $2,150 | $317,500 | $109,100 | $208,400 |
| 2017 | $2,044 | $295,800 | $109,100 | $186,700 |
| 2016 | $2,063 | $282,900 | $109,100 | $173,800 |
| 2015 | $2,147 | $286,300 | $116,400 | $169,900 |
| 2014 | $1,969 | $258,000 | $106,000 | $152,000 |
Source: Public Records
Map
Nearby Homes
- 11413 S Kitty Hawk Rd
- 5959 W Lake Ave
- 6101 W Lake Ave
- 5829 W Lake Ave
- 11603 S Holly Springs Dr
- 11609 S Holly Springs Dr
- Azalea Plan at SpringHouse Village - Floret
- Vega Plan at SpringHouse Village - Luminary
- Iris Plan at SpringHouse Village - Floret
- Altair Plan at SpringHouse Village - Luminary
- Sirius Plan at SpringHouse Village - Luminary
- Larkspur Plan at SpringHouse Village - Floret
- Lupine Plan at SpringHouse Village - Floret
- Primrose Plan at SpringHouse Village - Floret
- Marigold Plan at SpringHouse Village - Floret
- Rigel Plan at SpringHouse Village - Luminary
- Capella Plan at SpringHouse Village - Luminary
- 6108 W Sparrow View Dr
- 6156 W Poplar View Dr
- 6173 W Sparrow View Dr Unit 559
- 11534 Keystone Dr
- 11518 Keystone Dr
- 11534 S Keystone Dr
- 11542 Keystone Dr
- 11512 Keystone Dr
- 11542 S Keystone Dr
- 11502 Keystone Dr
- 11502 Keystone Dr Unit 6
- 11502 S Keystone Dr
- 11564 Keystone Dr
- 11564 S Keystone Dr
- 11492 S Keystone Dr
- 11492 Keystone Dr
- 11563 Keystone Dr
- 11563 S Keystone Dr
- 11499 S Keystone Dr
- 5897 Keystone Dr Unit 417
- 11499 Keystone Dr
- 11526 S Kitty Hawk Rd
- 11578 Keystone Dr