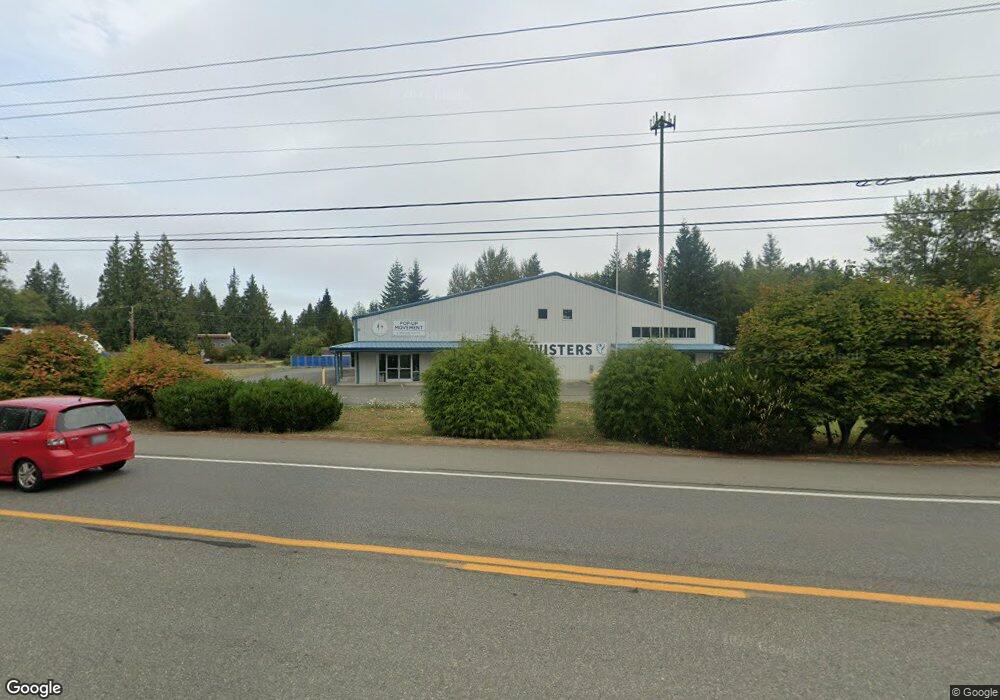
11526 Rhody Dr Unit A Port Hadlock, WA 98339
Port Hadlock-Irondale NeighborhoodEstimated Value: $857,858
--
Bed
--
Bath
13,419
Sq Ft
$64/Sq Ft
Est. Value
About This Home
This home is located at 11526 Rhody Dr Unit A, Port Hadlock, WA 98339 and is currently estimated at $857,858, approximately $63 per square foot. 11526 Rhody Dr Unit A is a home located in Jefferson County with nearby schools including Chimacum Creek Primary School, Chimacum School Pi Program, and Chimacum Elementary School.
Ownership History
Date
Name
Owned For
Owner Type
Purchase Details
Closed on
Nov 15, 2023
Sold by
Davis-Hughes Llc
Bought by
W Peppertree Property Llc
Current Estimated Value
Purchase Details
Closed on
Jul 26, 2013
Sold by
U S Bank Na
Bought by
Davis Hughes Llc
Purchase Details
Closed on
Jan 17, 2013
Sold by
Stclair Steven F and Stclair Margaret
Bought by
Us Bank Na
Purchase Details
Closed on
Sep 12, 2012
Sold by
Scram Ltd Llc
Bought by
St Clair Steven F
Purchase Details
Closed on
Aug 18, 2006
Sold by
St Clair Steven F and St Clair Margaret
Bought by
Scram Ltd Llc
Create a Home Valuation Report for This Property
The Home Valuation Report is an in-depth analysis detailing your home's value as well as a comparison with similar homes in the area
Home Values in the Area
Average Home Value in this Area
Purchase History
| Date | Buyer | Sale Price | Title Company |
|---|---|---|---|
| W Peppertree Property Llc | $800,000 | Frontier Title | |
| Davis Hughes Llc | -- | First American Title Insuran | |
| Us Bank Na | -- | Jefferson Title Co Inc | |
| St Clair Steven F | -- | None Available | |
| Scram Ltd Llc | -- | None Available |
Source: Public Records
Mortgage History
| Date | Status | Borrower | Loan Amount |
|---|---|---|---|
| Closed | W Peppertree Property Llc | $0 |
Source: Public Records
Tax History Compared to Growth
Tax History
| Year | Tax Paid | Tax Assessment Tax Assessment Total Assessment is a certain percentage of the fair market value that is determined by local assessors to be the total taxable value of land and additions on the property. | Land | Improvement |
|---|---|---|---|---|
| 2024 | $7,380 | $803,251 | $228,255 | $574,996 |
| 2023 | $7,380 | $934,823 | $223,255 | $711,568 |
| 2022 | $6,954 | $861,861 | $211,626 | $650,235 |
| 2021 | $7,395 | $783,497 | $192,374 | $591,123 |
| 2020 | $7,614 | $783,497 | $192,374 | $591,123 |
| 2019 | $7,553 | $783,497 | $192,374 | $591,123 |
| 2018 | $8,480 | $783,497 | $192,374 | $591,123 |
| 2017 | $6,920 | $770,997 | $179,874 | $591,123 |
| 2016 | $6,996 | $671,574 | $179,874 | $491,700 |
| 2015 | -- | $671,574 | $179,874 | $491,700 |
| 2014 | -- | $671,574 | $179,874 | $491,700 |
Source: Public Records
Map
Nearby Homes
- 12 Loretta Ln
- 13 Loretta Ln
- 52 E Moore St
- 51 Thomas Dr
- 0 E Eugene St
- 31 Petes Spur
- 781 Irondale Rd
- 371 E Price St
- 0 Prospect Ave Unit NWM2410763
- 0 Prospect Ave
- 31 2nd St
- 32 S Duquesne Ave
- 593 Prospect Ave
- 0 S Duquesne Ave
- 0 N Andrew Ave
- 611 Cedar Ave Unit 51
- 611 Cedar Ave Unit 33
- 611 Cedar Ave Unit 62
- 10955 NKA Rhody Dr
- 1210 Irondale Rd