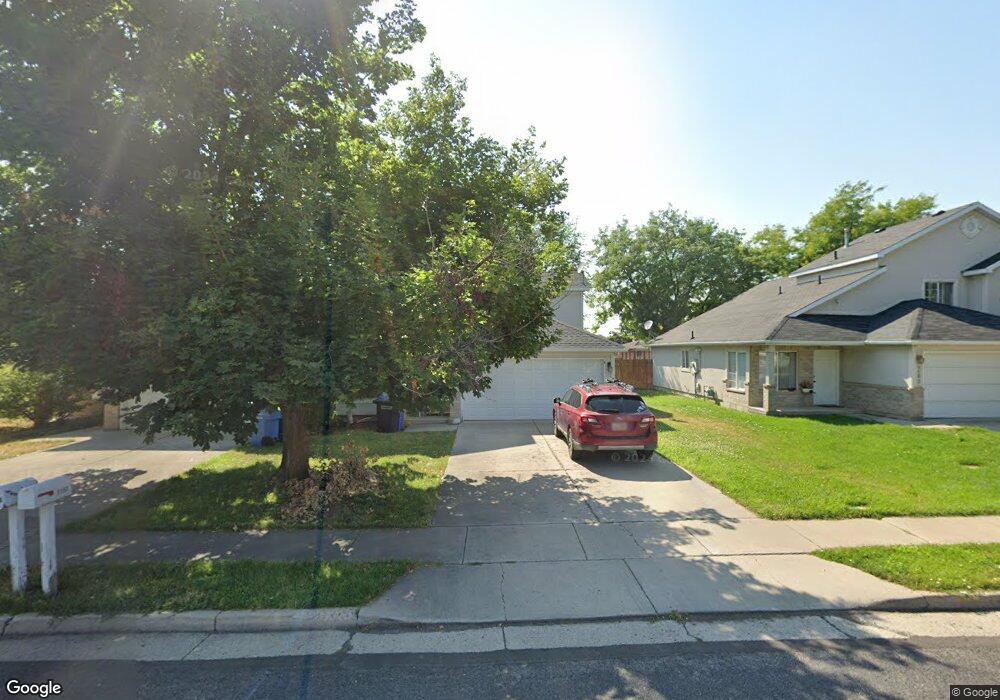
1153 N 230 W Logan, UT 84341
Bridger NeighborhoodEstimated Value: $330,000 - $381,187
3
Beds
2
Baths
1,476
Sq Ft
$234/Sq Ft
Est. Value
About This Home
This home is located at 1153 N 230 W, Logan, UT 84341 and is currently estimated at $345,797, approximately $234 per square foot. 1153 N 230 W is a home located in Cache County with nearby schools including Bridger School, Mount Logan Middle School, and Logan High School.
Ownership History
Date
Name
Owned For
Owner Type
Purchase Details
Closed on
Jan 8, 2013
Sold by
Hurley Sharon
Bought by
Sahely Camron
Current Estimated Value
Home Financials for this Owner
Home Financials are based on the most recent Mortgage that was taken out on this home.
Original Mortgage
$107,000
Outstanding Balance
$73,783
Interest Rate
3.27%
Mortgage Type
Purchase Money Mortgage
Estimated Equity
$272,014
Purchase Details
Closed on
Jun 4, 2010
Sold by
Peace Candice
Bought by
Hurley Sharon
Home Financials for this Owner
Home Financials are based on the most recent Mortgage that was taken out on this home.
Original Mortgage
$120,700
Interest Rate
5.03%
Mortgage Type
New Conventional
Purchase Details
Closed on
May 1, 2006
Sold by
Gibbons Andrew H
Bought by
Peace Candice
Create a Home Valuation Report for This Property
The Home Valuation Report is an in-depth analysis detailing your home's value as well as a comparison with similar homes in the area
Home Values in the Area
Average Home Value in this Area
Purchase History
| Date | Buyer | Sale Price | Title Company |
|---|---|---|---|
| Sahely Camron | -- | Cache Title Company | |
| Hurley Sharon | -- | Heritage Title | |
| Peace Candice | -- | Cache Title Company |
Source: Public Records
Mortgage History
| Date | Status | Borrower | Loan Amount |
|---|---|---|---|
| Open | Sahely Camron | $107,000 | |
| Previous Owner | Hurley Sharon | $120,700 |
Source: Public Records
Tax History Compared to Growth
Tax History
| Year | Tax Paid | Tax Assessment Tax Assessment Total Assessment is a certain percentage of the fair market value that is determined by local assessors to be the total taxable value of land and additions on the property. | Land | Improvement |
|---|---|---|---|---|
| 2025 | $1,551 | $364,781 | $132,600 | $232,181 |
| 2024 | $1,602 | $364,781 | $132,600 | $232,181 |
| 2023 | $1,668 | $362,181 | $130,000 | $232,181 |
| 2022 | $1,530 | $310,181 | $78,000 | $232,181 |
| 2021 | $1,311 | $225,745 | $40,000 | $185,745 |
| 2020 | $1,271 | $196,987 | $40,000 | $156,987 |
| 2019 | $1,328 | $196,986 | $40,000 | $156,986 |
| 2018 | $1,303 | $176,510 | $40,000 | $136,510 |
| 2017 | $1,184 | $84,755 | $0 | $0 |
| 2016 | $1,227 | $75,790 | $0 | $0 |
| 2015 | $1,024 | $70,655 | $0 | $0 |
| 2014 | $926 | $70,655 | $0 | $0 |
| 2013 | -- | $70,655 | $0 | $0 |
Source: Public Records
Map
Nearby Homes
- 2200 N 220 W
- 1030 N 130 W Unit 100
- 897 N 250 W
- 894 N 400 W
- 559 W 1350 N Unit 41
- 873 N 480 W
- 1515 N 450 W Unit 103
- 430 W 810 N
- 514 W 1490 N Unit 102
- 539 W 1465 N Unit 17-102
- 223 W 730 N
- 243 W 730 N
- 420 W 750 N
- 190 W 700 N
- 1492 N 565 W Unit 101
- 235 E 1100 N
- 227 W 690 N
- 702 N 100 W
- 446 W 1595 N Unit 103
- 345 W 690 N