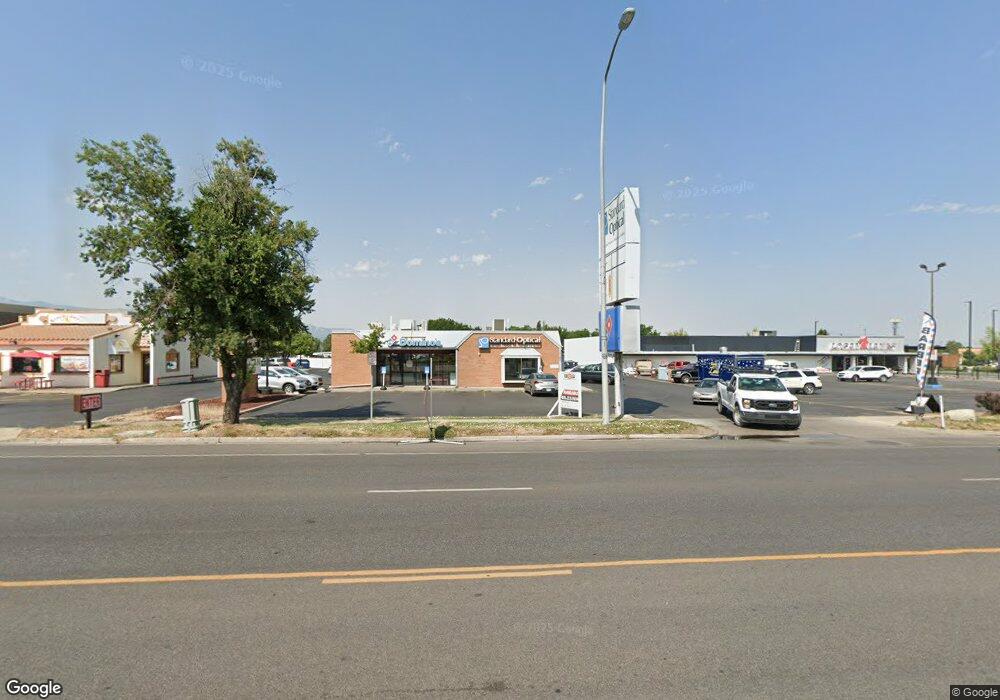
1153 N Main St Logan, UT 84341
Bridger NeighborhoodEstimated Value: $518,000
--
Bed
--
Bath
5,600
Sq Ft
$92/Sq Ft
Est. Value
About This Home
This home is located at 1153 N Main St, Logan, UT 84341 and is currently estimated at $518,000, approximately $92 per square foot. 1153 N Main St is a home located in Cache County with nearby schools including Bridger School, Mount Logan Middle School, and Logan High School.
Ownership History
Date
Name
Owned For
Owner Type
Purchase Details
Closed on
Jun 18, 2014
Sold by
Morrell Properties Llc
Bought by
Landlor Llc
Current Estimated Value
Home Financials for this Owner
Home Financials are based on the most recent Mortgage that was taken out on this home.
Original Mortgage
$500,000
Outstanding Balance
$379,915
Interest Rate
4.25%
Mortgage Type
Future Advance Clause Open End Mortgage
Estimated Equity
$104,085
Purchase Details
Closed on
Jul 20, 2006
Sold by
Leetzow Gale C
Bought by
Morrell Properties Llc
Home Financials for this Owner
Home Financials are based on the most recent Mortgage that was taken out on this home.
Original Mortgage
$862,500
Interest Rate
6.57%
Mortgage Type
Commercial
Purchase Details
Closed on
Jan 2, 2004
Sold by
Leetzow Gale C
Bought by
Leetzow Gale C
Create a Home Valuation Report for This Property
The Home Valuation Report is an in-depth analysis detailing your home's value as well as a comparison with similar homes in the area
Home Values in the Area
Average Home Value in this Area
Purchase History
| Date | Buyer | Sale Price | Title Company |
|---|---|---|---|
| Landlor Llc | -- | Hickman Land Title Co | |
| Morrell Properties Llc | -- | Cache Title Company | |
| Leetzow Gale C | -- | None Available | |
| Leetzow Gale C | -- | None Available |
Source: Public Records
Mortgage History
| Date | Status | Borrower | Loan Amount |
|---|---|---|---|
| Open | Landlor Llc | $500,000 | |
| Previous Owner | Morrell Properties Llc | $862,500 |
Source: Public Records
Tax History Compared to Growth
Tax History
| Year | Tax Paid | Tax Assessment Tax Assessment Total Assessment is a certain percentage of the fair market value that is determined by local assessors to be the total taxable value of land and additions on the property. | Land | Improvement |
|---|---|---|---|---|
| 2025 | $4,053 | $524,188 | $343,378 | $180,810 |
| 2024 | $3,935 | $492,972 | $312,162 | $180,810 |
| 2023 | $4,004 | $478,107 | $297,297 | $180,810 |
| 2022 | $4,161 | $463,950 | $283,140 | $180,810 |
| 2021 | $4,208 | $398,712 | $226,512 | $172,200 |
| 2020 | $4,676 | $398,712 | $226,512 | $172,200 |
| 2019 | $4,770 | $389,112 | $226,512 | $162,600 |
| 2018 | $5,224 | $389,112 | $226,512 | $162,600 |
| 2017 | $5,434 | $389,110 | $0 | $0 |
| 2016 | $5,634 | $389,110 | $0 | $0 |
| 2015 | $5,641 | $389,110 | $0 | $0 |
| 2014 | $5,099 | $389,110 | $0 | $0 |
| 2013 | -- | $440,160 | $0 | $0 |
Source: Public Records
Map
Nearby Homes
- 53 W 1150 N
- 40 W Cache Valley Blvd Unit 8 B&D
- 40 W Cache Valley Blvd Unit 8 A&C
- 40 W Cache Valley Blvd Unit 5A
- 40 W Cache Valley Blvd Unit C
- 40 W Cache Valley Blvd Unit 6B
- 40 W Cache Valley Blvd Unit 8B
- 40 W Cache Valley Blvd Unit 19
- 40 W Cache Valley Blvd
- 40 Skyridge Cir
- 49 W 1124 N
- 57 W 1124 N
- 95 W 1150 N
- 1145 N Main St
- 74 W 1150 N
- 1194 N 120 W
- 47 W 1124 N
- 55 W 1124 N
- 1196 N 120 W
- 1192 N 120 W