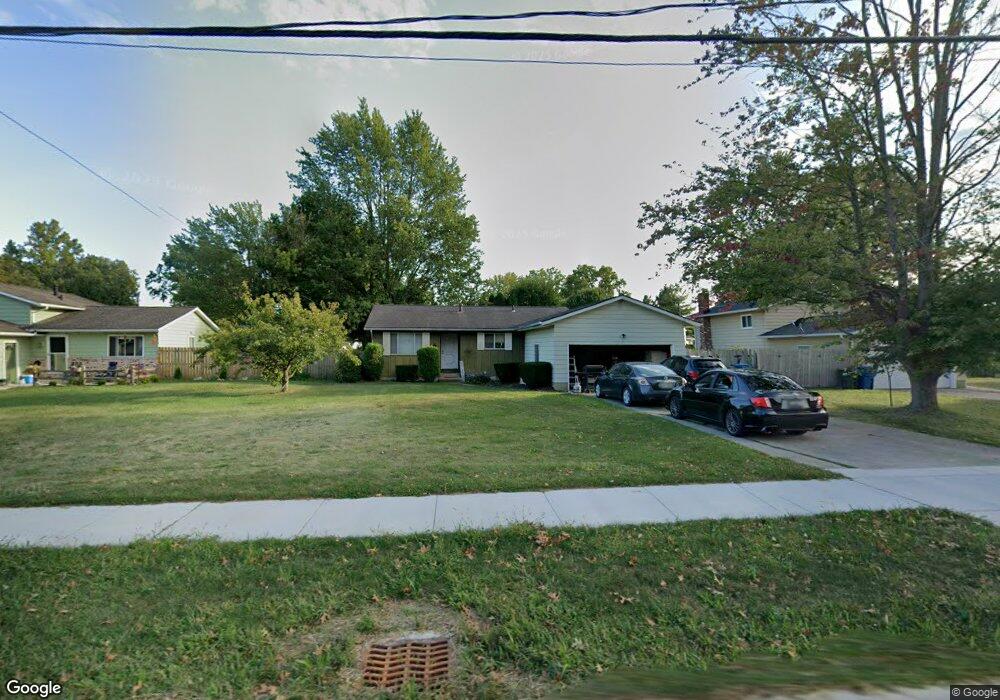
1153 Novak Rd Grafton, OH 44044
Estimated Value: $197,000 - $259,000
3
Beds
2
Baths
1,104
Sq Ft
$207/Sq Ft
Est. Value
About This Home
This home is located at 1153 Novak Rd, Grafton, OH 44044 and is currently estimated at $228,907, approximately $207 per square foot. 1153 Novak Rd is a home located in Lorain County with nearby schools including Midview West Elementary School, Midview North Elementary School, and Midview Middle School.
Ownership History
Date
Name
Owned For
Owner Type
Purchase Details
Closed on
Sep 14, 2001
Sold by
Walsh John M
Bought by
Walsh John M and Walsh Amanda J
Current Estimated Value
Home Financials for this Owner
Home Financials are based on the most recent Mortgage that was taken out on this home.
Original Mortgage
$85,400
Interest Rate
8.65%
Purchase Details
Closed on
Jan 31, 1998
Sold by
Walsh Linda M
Bought by
Walsh John M
Home Financials for this Owner
Home Financials are based on the most recent Mortgage that was taken out on this home.
Original Mortgage
$86,912
Interest Rate
7.24%
Mortgage Type
FHA
Purchase Details
Closed on
Jan 16, 1998
Sold by
Walsh John M and Walsh Linda M
Bought by
Walsh John M
Home Financials for this Owner
Home Financials are based on the most recent Mortgage that was taken out on this home.
Original Mortgage
$86,912
Interest Rate
7.24%
Mortgage Type
FHA
Create a Home Valuation Report for This Property
The Home Valuation Report is an in-depth analysis detailing your home's value as well as a comparison with similar homes in the area
Home Values in the Area
Average Home Value in this Area
Purchase History
| Date | Buyer | Sale Price | Title Company |
|---|---|---|---|
| Walsh John M | -- | Guardian Title | |
| Walsh John M | -- | -- | |
| Walsh John M | -- | Lorain County Title Co Inc |
Source: Public Records
Mortgage History
| Date | Status | Borrower | Loan Amount |
|---|---|---|---|
| Closed | Walsh John M | $85,400 | |
| Closed | Walsh John M | $86,912 |
Source: Public Records
Tax History Compared to Growth
Tax History
| Year | Tax Paid | Tax Assessment Tax Assessment Total Assessment is a certain percentage of the fair market value that is determined by local assessors to be the total taxable value of land and additions on the property. | Land | Improvement |
|---|---|---|---|---|
| 2024 | $2,394 | $54,331 | $16,933 | $37,398 |
| 2023 | $1,980 | $41,328 | $10,136 | $31,192 |
| 2022 | $1,975 | $41,328 | $10,136 | $31,192 |
| 2021 | $1,981 | $41,328 | $10,136 | $31,192 |
| 2020 | $1,730 | $34,530 | $8,470 | $26,060 |
| 2019 | $1,723 | $34,530 | $8,470 | $26,060 |
| 2018 | $1,744 | $34,530 | $8,470 | $26,060 |
| 2017 | $1,925 | $35,250 | $6,080 | $29,170 |
| 2016 | $1,953 | $35,250 | $6,080 | $29,170 |
| 2015 | $1,965 | $35,250 | $6,080 | $29,170 |
| 2014 | $1,924 | $33,890 | $5,840 | $28,050 |
| 2013 | $1,926 | $33,890 | $5,840 | $28,050 |
Source: Public Records
Map
Nearby Homes
- 551 N Main St
- 1077 Yarmouth Rd
- 1041 Plymouth Dr
- 694 Erie St
- 697 Main St
- 1129 Fox Run
- 1099 Huntsman Ct
- Bramante Ranch w/ Finished Basement Plan at Fox Run
- Alberti Ranch w/ Finished Basement Plan at Fox Run
- Palladio Ranch w/ Finished Basement Plan at Fox Run
- Savannah w/ Finished Basement Plan at Fox Run
- Cumberland w/ Finished Basement Plan at Fox Run
- 1167 Fox Run
- 1166 Hunting Hollow
- 1065 Sunshine Ct
- 1013 N Willow St
- 37340 Capel Rd
- 15490 Chamberlain Rd
- 34630 N Legends Way
- 40163 Banks Rd