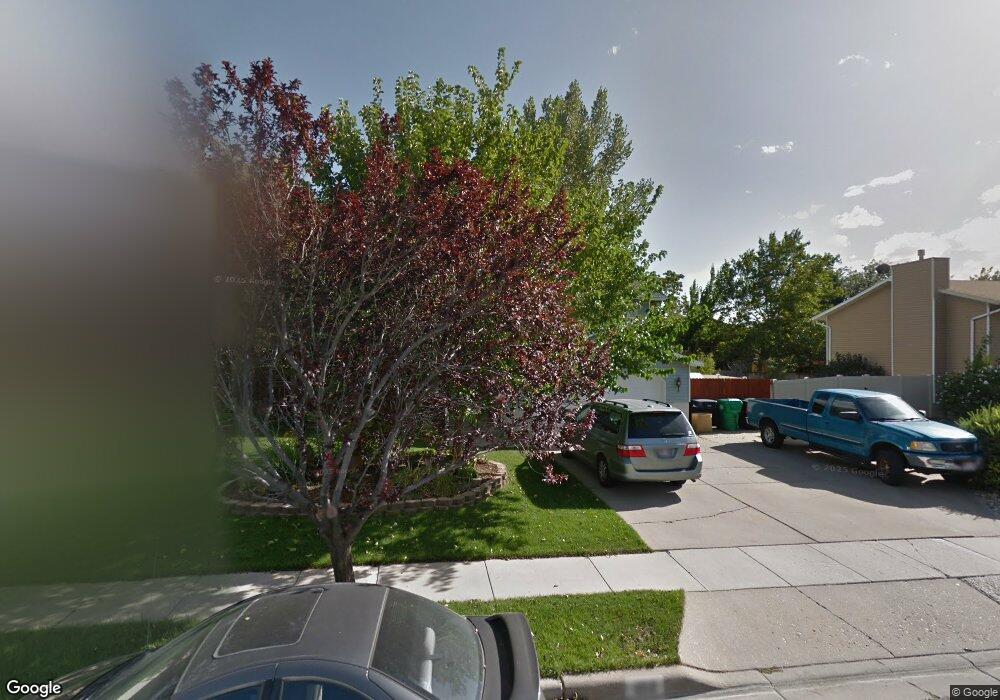
1153 W 1850 S Woods Cross, UT 84087
Estimated Value: $477,000 - $497,000
4
Beds
2
Baths
1,102
Sq Ft
$441/Sq Ft
Est. Value
About This Home
This home is located at 1153 W 1850 S, Woods Cross, UT 84087 and is currently estimated at $485,929, approximately $440 per square foot. 1153 W 1850 S is a home located in Davis County with nearby schools including Woods Cross Elementary School, South Davis Junior High School, and Woods Cross High School.
Ownership History
Date
Name
Owned For
Owner Type
Purchase Details
Closed on
May 2, 2012
Sold by
Hess Douglas and Hess Bobbie L
Bought by
Hess Bobbie L and Hess Douglas A
Current Estimated Value
Home Financials for this Owner
Home Financials are based on the most recent Mortgage that was taken out on this home.
Original Mortgage
$125,824
Interest Rate
4.05%
Mortgage Type
New Conventional
Purchase Details
Closed on
Mar 2, 2009
Sold by
Hess Bobbie L
Bought by
Hess Douglas and Hess Bobbie L
Purchase Details
Closed on
Sep 19, 1996
Sold by
Johnson G Clark and Johnson Debra
Bought by
Hess Bobbie L
Home Financials for this Owner
Home Financials are based on the most recent Mortgage that was taken out on this home.
Original Mortgage
$126,300
Interest Rate
7.88%
Create a Home Valuation Report for This Property
The Home Valuation Report is an in-depth analysis detailing your home's value as well as a comparison with similar homes in the area
Home Values in the Area
Average Home Value in this Area
Purchase History
| Date | Buyer | Sale Price | Title Company |
|---|---|---|---|
| Hess Bobbie L | -- | Bonneville Superior Title Co | |
| Hess Douglas | -- | Accommodation | |
| Hess Bobbie L | -- | Associated Title Company |
Source: Public Records
Mortgage History
| Date | Status | Borrower | Loan Amount |
|---|---|---|---|
| Closed | Hess Bobbie L | $125,824 | |
| Closed | Hess Bobbie L | $126,300 |
Source: Public Records
Tax History Compared to Growth
Tax History
| Year | Tax Paid | Tax Assessment Tax Assessment Total Assessment is a certain percentage of the fair market value that is determined by local assessors to be the total taxable value of land and additions on the property. | Land | Improvement |
|---|---|---|---|---|
| 2025 | $2,822 | $244,750 | $109,958 | $134,792 |
| 2024 | $2,647 | $234,850 | $116,886 | $117,964 |
| 2023 | $2,491 | $411,000 | $154,544 | $256,456 |
| 2022 | $2,518 | $231,000 | $67,185 | $163,815 |
| 2021 | $2,243 | $327,000 | $98,451 | $228,549 |
| 2020 | $1,999 | $288,000 | $93,665 | $194,335 |
| 2019 | $1,967 | $279,000 | $87,563 | $191,437 |
| 2018 | $1,826 | $257,000 | $86,141 | $170,859 |
| 2016 | $1,588 | $122,485 | $36,326 | $86,159 |
| 2015 | $1,443 | $107,305 | $36,326 | $70,979 |
| 2014 | $1,370 | $104,872 | $36,326 | $68,546 |
| 2013 | -- | $105,582 | $24,540 | $81,042 |
Source: Public Records
Map
Nearby Homes
- 1255 W 2050 S
- 2024 S 925 W
- 916 W 2025 S
- 1384 W 2175 S
- 913 W 2025 S
- 1623 S 925 W
- 1288 S 1050 W
- 1984 S 1500 W
- 1552 S 850 W
- 1334 W 1300 S
- 1309 W 1200 S
- 1137 S 1050 W
- 1422 W 1300 S
- 770 W 1900 S
- 1998 S 1600 W
- 1321 S 840 W
- 1069 W Linden Ln Unit 31
- 2008 S 700 W
- 1072 W Audrey Ln Unit 17
- 1064 W Audrey Ln Unit 15