Estimated Value: $43,000 - $57,878
2
Beds
1
Bath
880
Sq Ft
$58/Sq Ft
Est. Value
About This Home
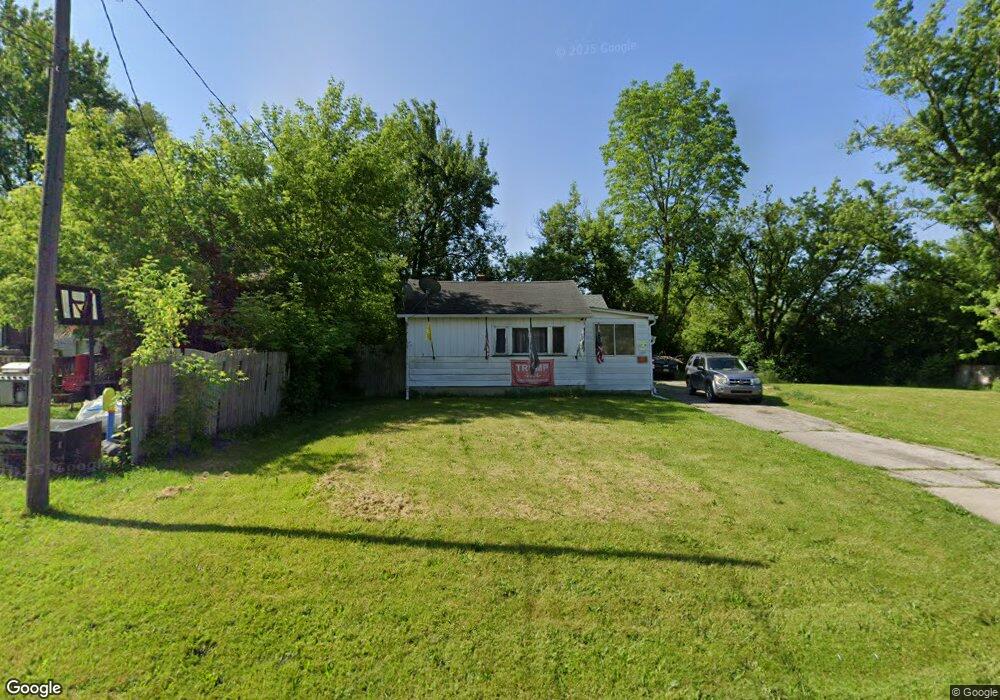
This home is located at 1153 W Princeton Ave, Flint, MI 48505 and is currently estimated at $50,970, approximately $57 per square foot. 1153 W Princeton Ave is a home located in Genesee County with nearby schools including Beecher High School, The New Standard Academy, and St. Mary's School.
Ownership History
Date
Name
Owned For
Owner Type
Purchase Details
Closed on
Jan 7, 2020
Sold by
Perkins Daniel E and Perkins Louise S
Bought by
Veld Rachel Viede
Current Estimated Value
Purchase Details
Closed on
Oct 2, 2012
Sold by
Parker William J
Bought by
Perkins Daniel E and Perkins Louise S
Purchase Details
Closed on
Aug 23, 2011
Sold by
Perkins Ilona Paula
Bought by
Perkins Daniel Eugene
Purchase Details
Closed on
Nov 1, 2010
Sold by
Perkins Daniel E
Bought by
William J Parker Trust
Purchase Details
Closed on
Dec 16, 2008
Sold by
Smith Richard William and Smith Kathleen M
Bought by
Parker William J and The William J Parker Trust
Purchase Details
Closed on
Mar 15, 2006
Sold by
Secretary Of Veterans Affairs
Bought by
Leach John C and Leach Rose M
Purchase Details
Closed on
Sep 20, 2004
Sold by
Leach John P
Bought by
Leach John P and John C & Rose M Leach Trust
Purchase Details
Closed on
Jul 31, 2001
Sold by
Gilbert Carole
Bought by
Leach John P and Leach Tracy M
Create a Home Valuation Report for This Property
The Home Valuation Report is an in-depth analysis detailing your home's value as well as a comparison with similar homes in the area
Home Values in the Area
Average Home Value in this Area
Purchase History
| Date | Buyer | Sale Price | Title Company |
|---|---|---|---|
| Veld Rachel Viede | -- | None Available | |
| Perkins Daniel E | -- | None Available | |
| Perkins Daniel Eugene | -- | None Available | |
| William J Parker Trust | -- | Sargents Title Company | |
| Parker William J | $10,270 | None Available | |
| Leach John C | -- | Guaranty Title Company | |
| Leach John P | -- | Guaranty Title Company | |
| Leach John P | -- | Guaranty Title Company | |
| Smith Richard W | $6,500 | Guaranty Title Company | |
| Leach John P | -- | -- |
Source: Public Records
Tax History Compared to Growth
Tax History
| Year | Tax Paid | Tax Assessment Tax Assessment Total Assessment is a certain percentage of the fair market value that is determined by local assessors to be the total taxable value of land and additions on the property. | Land | Improvement |
|---|---|---|---|---|
| 2025 | $692 | $15,600 | $0 | $0 |
| 2024 | $119 | $14,500 | $0 | $0 |
| 2023 | $114 | $12,500 | $0 | $0 |
| 2022 | $615 | $10,800 | $0 | $0 |
| 2021 | $612 | $9,100 | $0 | $0 |
| 2020 | $55 | $7,900 | $0 | $0 |
| 2019 | $54 | $7,500 | $0 | $0 |
| 2018 | $437 | $6,600 | $0 | $0 |
| 2017 | $445 | $8,700 | $0 | $0 |
| 2016 | $443 | $9,100 | $0 | $0 |
| 2015 | $310 | $6,900 | $0 | $0 |
| 2014 | $53 | $4,700 | $0 | $0 |
| 2012 | -- | $5,100 | $5,100 | $0 |
Source: Public Records
Map
Nearby Homes
- 1199 Peachtree Dr
- 5218 Summit St
- 1020 E Princeton Ave
- 1297 W Kurtz Ave
- 1359 W Princeton Ave
- 5485 Detroit St
- 1258 Peachtree Dr
- 1188 Camellia Dr
- 1169 Oleander Dr
- 1181 Oleander Dr
- 0 Detroit St Unit 50166420
- 1395 W Yale Ave
- 1207 Orange Blossom Dr
- 1080 E Cornell Ave
- 6136 Flowerday Dr
- 6069 Natchez Dr
- 5471 Fairhaven St
- 6123 Palmetto Dr
- 1151 E Cornell Ave
- 1023 E Princeton Ave
- 1159 W Princeton Ave
- 1151 W Princeton Ave
- 1165 W Princeton Ave
- 1154 W Princeton Ave
- 1139 W Princeton Ave
- 1173 W Princeton Ave
- 1145 W Princeton Ave
- 1160 W Princeton Ave
- 1142 W Princeton Ave
- 1146 W Yale Ave
- 1166 W Princeton Ave
- 1181 W Princeton Ave
- 5379 Summit St
- 1127 W Princeton Ave
- 1151 W Harvard Ave
- 5344 Summit St
- 1185 W Princeton Ave
- 1151 W Yale Ave
- 1128 W Yale Ave
- 1184 W Princeton Ave