11530 Tee Time Cir New Port Richey, FL 34654
River Ridge NeighborhoodEstimated Value: $368,000 - $399,000
3
Beds
2
Baths
1,679
Sq Ft
$230/Sq Ft
Est. Value
About This Home
This home is located at 11530 Tee Time Cir, New Port Richey, FL 34654 and is currently estimated at $386,466, approximately $230 per square foot. 11530 Tee Time Cir is a home located in Pasco County with nearby schools including River Ridge High School, Cypress Elementary School, and River Ridge Middle School.
Ownership History
Date
Name
Owned For
Owner Type
Purchase Details
Closed on
Apr 28, 2020
Sold by
Chubbuck Larry L and Chubbuck Carlene K
Bought by
Buresh Arlene and Buresh Laddie
Current Estimated Value
Purchase Details
Closed on
Jul 2, 2018
Sold by
Chubbuck Larry L and Chubbuck Carlene
Bought by
Chubbuck Larry L and Chubbuck Carlene K
Purchase Details
Closed on
Dec 15, 2016
Sold by
Louwaert Richard J and Louwaert Kelly A
Bought by
Chubbuck Larry L and Chubbuck Carlene
Home Financials for this Owner
Home Financials are based on the most recent Mortgage that was taken out on this home.
Original Mortgage
$100,000
Interest Rate
3.57%
Mortgage Type
Unknown
Purchase Details
Closed on
Jan 25, 2005
Sold by
N G Development Corp
Bought by
Louwaert Richard J and Louwaert Kelly A
Home Financials for this Owner
Home Financials are based on the most recent Mortgage that was taken out on this home.
Original Mortgage
$135,000
Interest Rate
5.62%
Mortgage Type
Unknown
Create a Home Valuation Report for This Property
The Home Valuation Report is an in-depth analysis detailing your home's value as well as a comparison with similar homes in the area
Home Values in the Area
Average Home Value in this Area
Purchase History
| Date | Buyer | Sale Price | Title Company |
|---|---|---|---|
| Buresh Arlene | $250,000 | First American Title Ins Co | |
| Chubbuck Larry L | -- | Attorney | |
| Chubbuck Larry L | $192,000 | Janiee K Candelario | |
| Louwaert Richard J | $185,100 | Heartland Title Company |
Source: Public Records
Mortgage History
| Date | Status | Borrower | Loan Amount |
|---|---|---|---|
| Previous Owner | Chubbuck Larry L | $100,000 | |
| Previous Owner | Louwaert Richard J | $135,000 |
Source: Public Records
Tax History Compared to Growth
Tax History
| Year | Tax Paid | Tax Assessment Tax Assessment Total Assessment is a certain percentage of the fair market value that is determined by local assessors to be the total taxable value of land and additions on the property. | Land | Improvement |
|---|---|---|---|---|
| 2025 | $4,069 | $276,660 | -- | -- |
| 2024 | $4,069 | $268,870 | -- | -- |
| 2023 | $3,917 | $261,040 | $71,172 | $189,868 |
| 2022 | $3,518 | $253,440 | $0 | $0 |
| 2021 | $3,451 | $246,067 | $53,280 | $192,787 |
| 2020 | $2,248 | $170,710 | $39,588 | $131,122 |
| 2019 | $2,204 | $166,880 | $39,588 | $127,292 |
| 2018 | $2,159 | $163,768 | $0 | $0 |
| 2017 | $2,146 | $160,400 | $32,088 | $128,312 |
| 2016 | $2,475 | $143,664 | $32,088 | $111,576 |
| 2015 | $2,276 | $126,108 | $32,088 | $94,020 |
| 2014 | $2,171 | $122,632 | $32,088 | $90,544 |
Source: Public Records
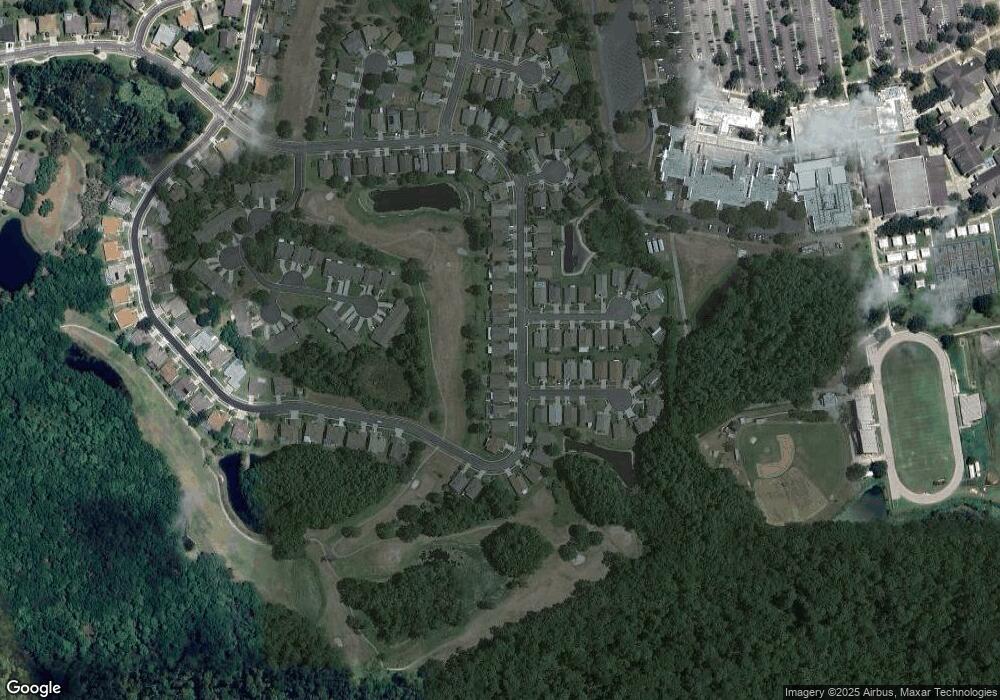
Map
Nearby Homes
- 11520 Lounds Ct
- 11506 Dampier Ct
- 11418 Tee Time Cir
- 11343 Tee Time Cir
- 11915 Tee Time Cir
- 7739 Harbor Bridge Blvd
- 7814 Brisbane Ct
- 7821 Floradora Dr
- 7825 Prospect Hill Cir
- 0 Moon Lake Rd Unit MFRW7863538
- 7940 Fashion Loop
- 11142 Port Douglas Dr
- 11149 Port Douglas Dr
- 7633 Piping Rock Ct
- 10908 Claymont Dr
- 7825 Burnet Ln
- 10900 Livingston Dr
- 12031 Penzance Ln
- 11324 Striped Bass Ct
- 10718 Fiddlesticks Ct
- 11524 Tee Time Cir
- 11536 Tee Time Cir
- 11518 Tee Time Cir
- 11444 Lounds Ct
- 11443 Dampier Ct
- 11512 Tee Time Cir
- 11548 Tee Time Cir
- 11450 Lounds Ct
- 11449 Dampier Ct
- 11506 Tee Time Cir
- 11602 Tee Time Cir
- 11443 Lounds Ct
- 11506 Lounds Ct
- 11505 Dampier Ct
- 11608 Tee Time Cir
- 11444 Dampier Ct
- 11500 Tee Time Cir
- 11449 Lounds Ct
- 11450 Dampier Ct
- 11512 Lounds Ct