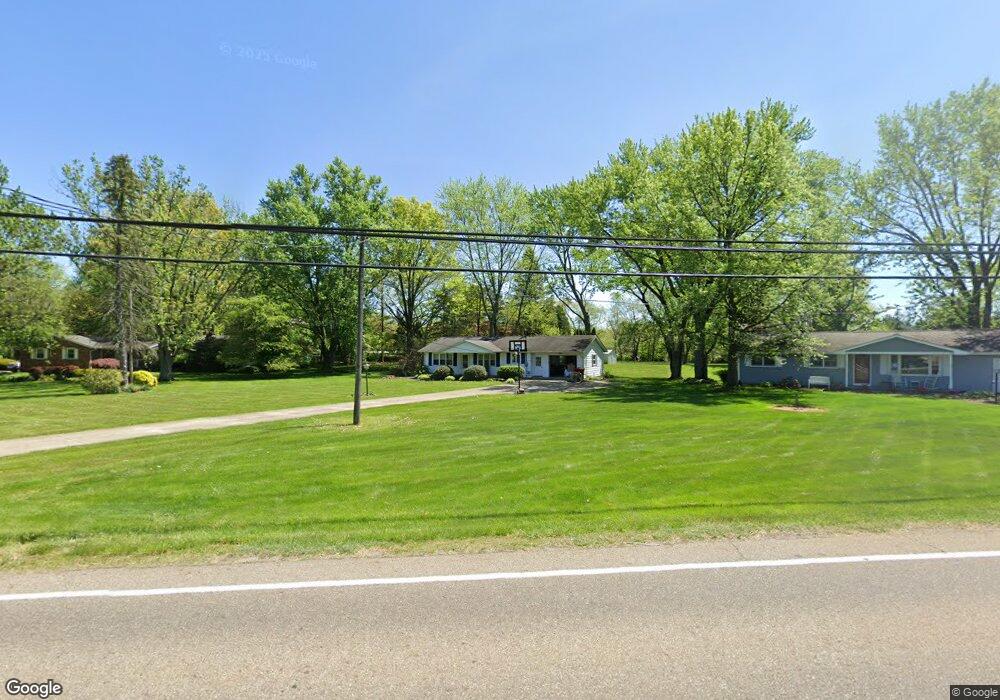
11536 Market Ave NE Uniontown, OH 44685
Estimated Value: $195,000 - $214,000
2
Beds
1
Bath
1,040
Sq Ft
$196/Sq Ft
Est. Value
About This Home
This home is located at 11536 Market Ave NE, Uniontown, OH 44685 and is currently estimated at $204,090, approximately $196 per square foot. 11536 Market Ave NE is a home located in Stark County with nearby schools including Lake Middle/High School and Lake Center Christian School.
Ownership History
Date
Name
Owned For
Owner Type
Purchase Details
Closed on
Nov 22, 2016
Sold by
Sommers Benjamin V and Sommers Vernon
Bought by
Troyer Terry A
Current Estimated Value
Home Financials for this Owner
Home Financials are based on the most recent Mortgage that was taken out on this home.
Original Mortgage
$116,400
Outstanding Balance
$93,596
Interest Rate
3.47%
Mortgage Type
New Conventional
Estimated Equity
$110,494
Purchase Details
Closed on
Apr 12, 2016
Sold by
Sommers Mary Magdalena
Bought by
Sommers Benjamin and Sommers Vernon
Purchase Details
Closed on
Aug 19, 2004
Sold by
Sommers Mary Magdalena
Bought by
Sommers Mary Magdalena and The Mary Magdalena Sommers Trust
Home Financials for this Owner
Home Financials are based on the most recent Mortgage that was taken out on this home.
Original Mortgage
$62,660
Interest Rate
3.82%
Mortgage Type
Seller Take Back
Create a Home Valuation Report for This Property
The Home Valuation Report is an in-depth analysis detailing your home's value as well as a comparison with similar homes in the area
Home Values in the Area
Average Home Value in this Area
Purchase History
| Date | Buyer | Sale Price | Title Company |
|---|---|---|---|
| Troyer Terry A | $120,000 | None Available | |
| Sommers Benjamin | $69,700 | None Available | |
| Sommers Mary Magdalena | -- | -- | |
| Sommers Benjamin | $69,660 | -- |
Source: Public Records
Mortgage History
| Date | Status | Borrower | Loan Amount |
|---|---|---|---|
| Open | Troyer Terry A | $116,400 | |
| Previous Owner | Sommers Benjamin | $62,660 |
Source: Public Records
Tax History Compared to Growth
Tax History
| Year | Tax Paid | Tax Assessment Tax Assessment Total Assessment is a certain percentage of the fair market value that is determined by local assessors to be the total taxable value of land and additions on the property. | Land | Improvement |
|---|---|---|---|---|
| 2025 | -- | $51,530 | $20,480 | $31,050 |
| 2024 | -- | $51,530 | $20,480 | $31,050 |
| 2023 | $2,133 | $44,770 | $12,320 | $32,450 |
| 2022 | $2,140 | $44,770 | $12,320 | $32,450 |
| 2021 | $2,165 | $44,770 | $12,320 | $32,450 |
| 2020 | $2,071 | $38,370 | $10,610 | $27,760 |
| 2019 | $2,054 | $38,370 | $10,610 | $27,760 |
| 2018 | $2,008 | $38,370 | $10,610 | $27,760 |
| 2017 | $1,840 | $32,660 | $10,780 | $21,880 |
| 2016 | $1,322 | $32,170 | $10,780 | $21,390 |
| 2015 | $1,321 | $32,170 | $10,780 | $21,390 |
| 2014 | $1,195 | $30,810 | $10,330 | $20,480 |
| 2013 | $598 | $30,810 | $10,330 | $20,480 |
Source: Public Records
Map
Nearby Homes
- 1037 Canyon St NE
- 12055 King Church Ave NW
- 531 Gentlebrook Blvd SW
- 786 Fair Vista Cir SW
- 778 Fair Vista Cir SW
- 525 Gentlebrook Blvd SW
- 747 Grandview Cir
- 550 Woodlands Glen Ave
- 12201 King Church Ave NW
- 510 Meadow Cir SW Unit 11
- 11900 Geib Ave NE
- Unit 9 Meadow Trail SW Unit 9
- 425 Tonawanda Trail SW
- 225 Seneca Trail SW
- 2084 Hazel St NE
- 11121 Geib Ave NE
- 1180 Tessa Trail Unit 1180
- 12725 Bixler Ave NE
- 330 Belle Ave SW
- 1771 Midway St NW
- 11520 Market Ave NE
- 11540 Market Ave NE
- 11552 Market Ave NE
- 11543 Market Ave NW
- 11440 Market Ave NE
- 11483 Market Ave NW
- 11560 Market Ave NE
- 11451 Market Ave NW
- 11616 Market Ave NE
- 11395 Market Ave NW
- 11383 Market Ave N
- 11395 Market Ave NE
- 11610 Market Ave NE
- 11383 Market Ave NW
- 1050 Lookout St NW
- 11514 Streamview Ave NW
- 11677 Market Ave NW
- 1080 Lookout St NW
- 11660 Market Ave NE
- 11620 Market Ave NE