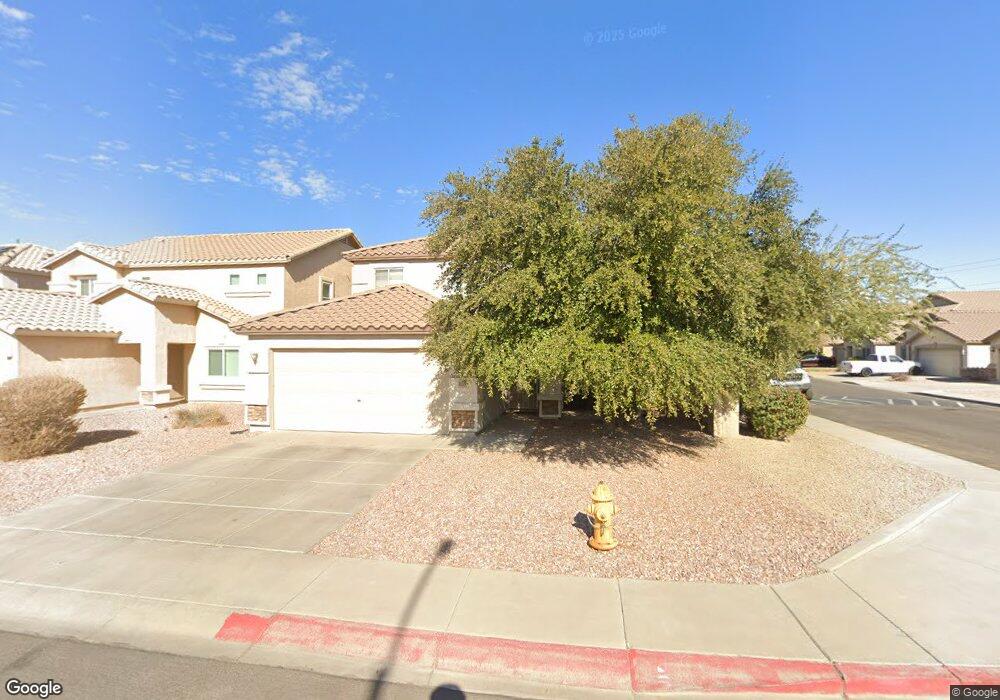
11538 W Brown St Youngtown, AZ 85363
Estimated Value: $369,000 - $420,000
3
Beds
3
Baths
2,002
Sq Ft
$197/Sq Ft
Est. Value
About This Home
This home is located at 11538 W Brown St, Youngtown, AZ 85363 and is currently estimated at $393,987, approximately $196 per square foot. 11538 W Brown St is a home located in Maricopa County with nearby schools including Luke Elementary School, Dysart High School, and Desert Mirage Elementary School.
Ownership History
Date
Name
Owned For
Owner Type
Purchase Details
Closed on
Aug 21, 2014
Sold by
Esquer Investments Llc
Bought by
Cromwell Sv Llc
Current Estimated Value
Purchase Details
Closed on
Jun 5, 2014
Sold by
Wisbey Alesha D and Mcknight Broc A
Bought by
Esquer Investments Llc
Purchase Details
Closed on
Feb 2, 2009
Sold by
The Bank Of New York Mellon
Bought by
Wisbey Alesha D and Mcknight Broc A
Home Financials for this Owner
Home Financials are based on the most recent Mortgage that was taken out on this home.
Original Mortgage
$115,862
Interest Rate
5.08%
Mortgage Type
FHA
Purchase Details
Closed on
Apr 25, 2008
Sold by
Blackwell Scott
Bought by
The Bank Of New York and Equity One Inc Mortgage Pass Through Cer
Purchase Details
Closed on
Feb 16, 2005
Sold by
Pulte Home Corp
Bought by
Blackwell Scott E
Home Financials for this Owner
Home Financials are based on the most recent Mortgage that was taken out on this home.
Original Mortgage
$160,350
Interest Rate
7.5%
Mortgage Type
New Conventional
Create a Home Valuation Report for This Property
The Home Valuation Report is an in-depth analysis detailing your home's value as well as a comparison with similar homes in the area
Home Values in the Area
Average Home Value in this Area
Purchase History
| Date | Buyer | Sale Price | Title Company |
|---|---|---|---|
| Cromwell Sv Llc | -- | Magnus Title Agency | |
| Esquer Investments Llc | $116,000 | None Available | |
| Wisbey Alesha D | $118,000 | Guaranty Title Agency | |
| The Bank Of New York | $175,000 | Tnt | |
| Blackwell Scott E | $200,461 | Sun Title Agency Co |
Source: Public Records
Mortgage History
| Date | Status | Borrower | Loan Amount |
|---|---|---|---|
| Previous Owner | Wisbey Alesha D | $115,862 | |
| Previous Owner | Blackwell Scott E | $160,350 | |
| Closed | Blackwell Scott E | $40,100 |
Source: Public Records
Tax History Compared to Growth
Tax History
| Year | Tax Paid | Tax Assessment Tax Assessment Total Assessment is a certain percentage of the fair market value that is determined by local assessors to be the total taxable value of land and additions on the property. | Land | Improvement |
|---|---|---|---|---|
| 2025 | $1,944 | $12,280 | -- | -- |
| 2024 | $1,855 | $11,696 | -- | -- |
| 2023 | $1,855 | $26,770 | $5,350 | $21,420 |
| 2022 | $1,703 | $20,570 | $4,110 | $16,460 |
| 2021 | $1,693 | $18,950 | $3,790 | $15,160 |
| 2020 | $1,666 | $17,500 | $3,500 | $14,000 |
| 2019 | $1,604 | $15,530 | $3,100 | $12,430 |
| 2018 | $1,603 | $13,760 | $2,750 | $11,010 |
| 2017 | $1,597 | $12,470 | $2,490 | $9,980 |
| 2016 | $1,537 | $11,910 | $2,380 | $9,530 |
| 2015 | $1,574 | $10,850 | $2,170 | $8,680 |
Source: Public Records
Map
Nearby Homes
- 11534 W Longley Ln
- 11622 W Brown St
- 11590 W Mountain View Rd
- 11566 W Purdue Ave
- 11553 W Purdue Ave
- 11627 W Hackbarth Dr
- 10287 N 115th Ave
- Payson Plan at Ridgeview
- 10299 N 115th Ave
- Taos Plan at Ridgeview
- Bisbee Plan at Ridgeview
- 10293 N 115th Ave
- 11563 W Palo Verde Ave
- 11589 W Lee Ln
- 10311 N 115th Ave
- 10317 N 115th Ave
- 11588 W Lee Ln
- 11598 W Vogel Ave
- 10329 N 115th Ave
- 11513 W Arron Dr
- 11544 W Brown St
- 11550 W Brown St
- 11537 W Cheryl Dr
- 11543 W Cheryl Dr
- 11556 W Brown St
- 10367 N 115th Dr
- 10373 N 115th Dr
- 11549 W Cheryl Dr
- 10361 N 115th Dr
- 11541 W Brown St
- 11541 W Brown St
- 10379 N 115th Dr
- 11547 W Brown St
- 10355 N 115th Dr
- 11555 W Cheryl Dr
- 11553 W Brown St
- 11562 W Brown St
- 10385 N 115th Dr
- 11559 W Brown St
- 11561 W Cheryl Dr